

| << Chapter < Page | Chapter >> Page > |
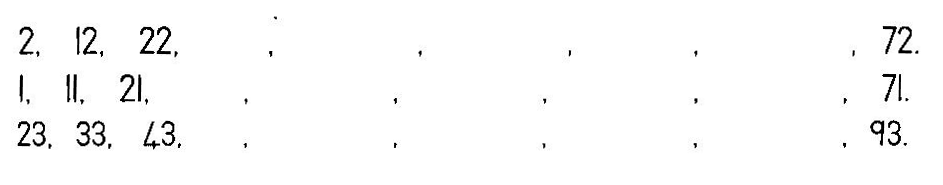
| LO 2.2 |
| 1610 + 6 | 24. . . . . . . . . . . | 36. . . . . . . . . . . | 40. . . . . . . . . . . | 58. . . . . . . . . . . |
| 51. . . . . . . . . . . | 13. . . . . . . . . . . | 29. . . . . . . . . . . | 94. . . . . . . . . . . | 62. . . . . . . . . . . |
| 87. . . . . . . . . . . | 50. . . . . . . . . . . | 96. . . . . . . . . . . | 83. . . . . . . . . . . | 74. . . . . . . . . . . |
58 ____________________________________
94 ____________________________________
62 ____________________________________
74 ____________________________________
36 ____________________________________
87 ____________________________________
40 ____________________________________
13 ____________________________________
16 4 19 23 11
____________________________________________________________________
| LO 1.3 | LO 1.4 | LO 1.10 |
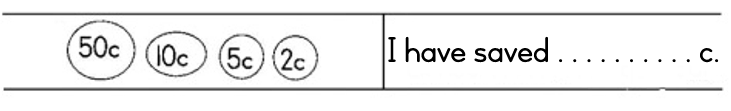
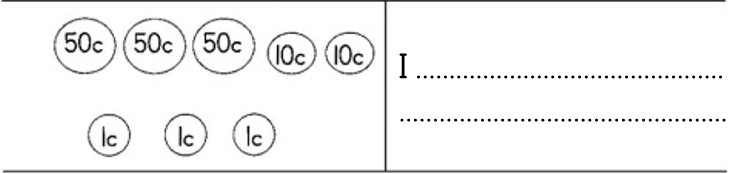
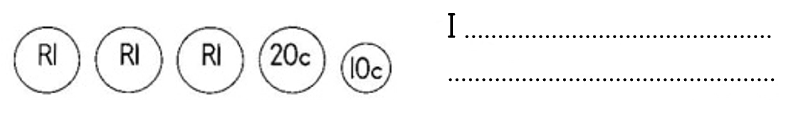
_____________________________________ has saved the most.
_____________________________________ has saved the least.
Sisulu has saved more than ______________________________________________
 LO 1.4 LO 1.4 |
LO 1.6 |
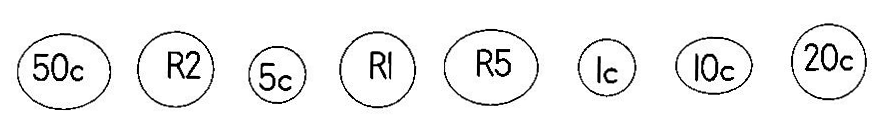
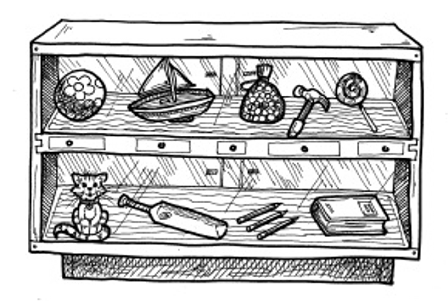
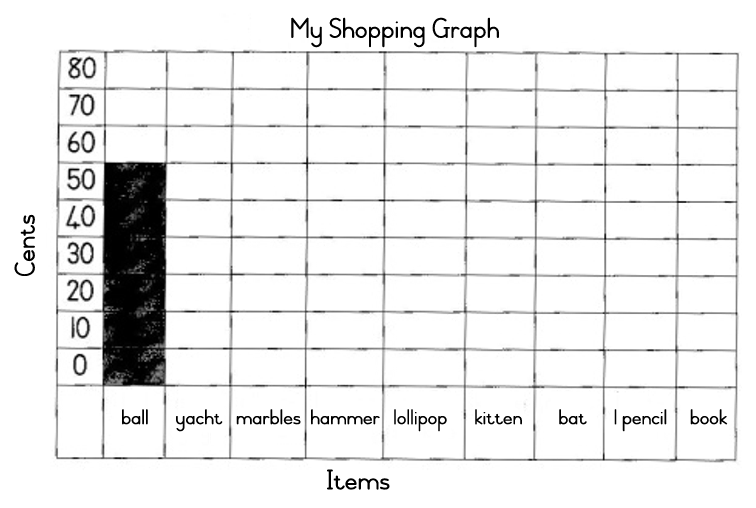
ball 60c, yacht 55c, marbles 30c, hammer 25c, lollipop 10c, kitten 75c, racket 45c, 1 pencil 20c, book 30c
| LO 5.4 |
Liz bought a _________________________ for a ______________________ c.
She paid:
_____________________________________________________________________
Sally bought a _________________________ for ______________________ c.
She paid:
_____________________________________________________________________
Mike bought a_________________________ for ______________________ c.
He paid:
_____________________________________________________________________
Tom bought a ________________________ for____________________ c.
He paid:
_____________________________________________________________________
I bought a hammer for 25c. I paid: 10c + 20c. My change was ________________
| LO 1.6 |
| LO 1.6 |
| LO 1.8 | LO 3.8 |
Learning Outcome 1: The learner will be able to recognise, describe and represent numbers and their relationships, and to count, estimate, calculate and check with competence and confidence in solving problems.
Assessment Standard 1.3: We know this when the learner knows and reads number symbols from 1 to at least 200 and writes number names from 1 to at least 100;
Assessment Standard 1.4: We know this when the learner orders, describes and compares numbers:
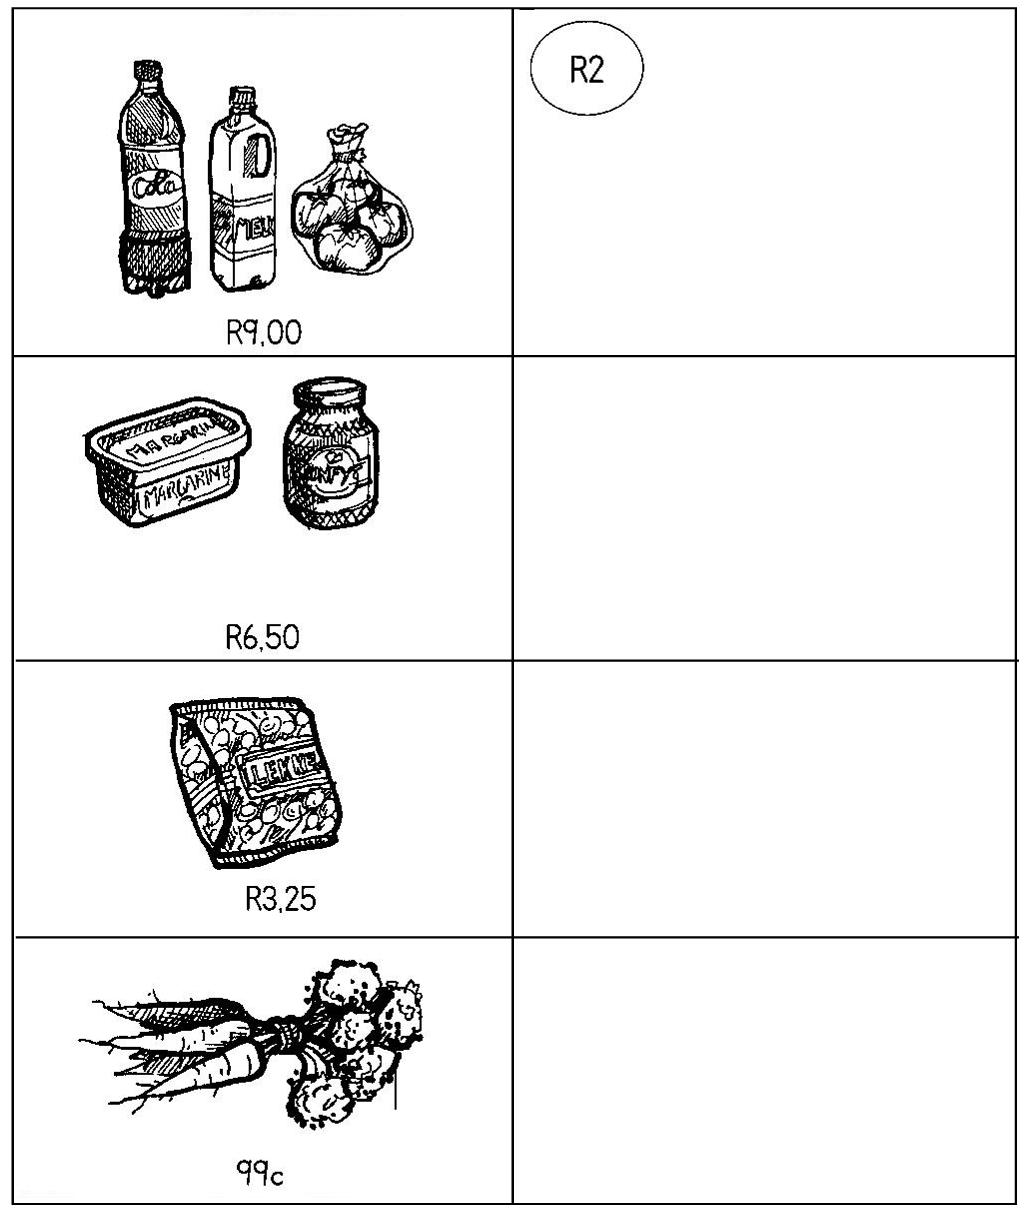
Assessment Standard 1.6: We know this when the learner solves money problems involving totals and change in rand and cents;
Assessment Standard 1.8: We know this when the learner can perform calculations, using appropriate symbols, to solve problems;
Assessment Standard 1.10: We know this when the learner uses the following techniques:
1.10.1 building up and breaking down numbers;
1.10.2 doubling and halving;
1.10.3 using concrete apparatus (e.g. counters);
1.10.4 number-lines;
Learning Outcome 2: The learner will be able to recognise, describe and represent patterns and relationships, as well as to solve problems using algebraic language and skills.
Assessment Standard 2.2: We know this when the learner copies and extends simple number sequences to at least 200.
Learning Outcome 3: The learner will be able to describe and represent characteristics and relationships between two-dimensional shapes and three-dimensional objects in a variety of orientations and positions.
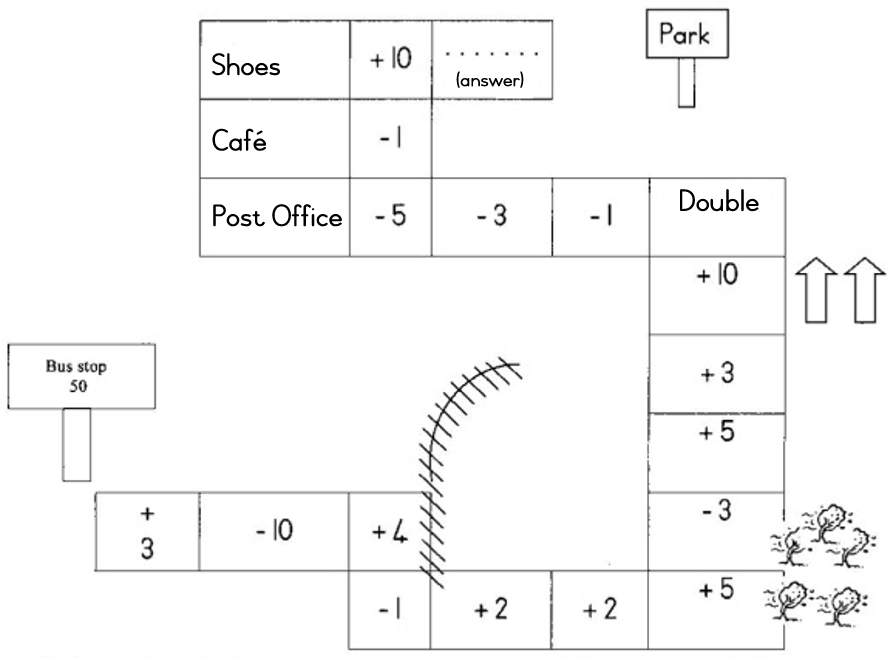
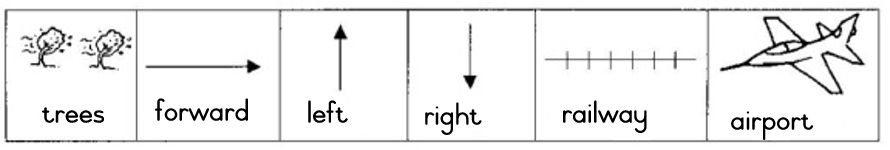
Assessment Standard 3.8: We know this when the learner understands direction.
Learning Outcome 5: The learner will be able to collect, summarise, display and critically analyse data in order to draw conclusions and make predictions, and to interpret and determine chance variation.
Assessment Standard 5.1: We know this when the learner collects data (alone and/or as a member of a group or team) in the classroom and school environment to answer questions posed by the teacher (e.g. ‘how many learners are there in each classroom?’);
Assessment Standard 5.4: We know this when the learner draws pictures and constructs pictographs that have a 1-1 correspondence between own data and representations;
Assessment Standard 5.5: We know this when the learner describes own or a peer’s collection of objects, explains how it was sorted, and answers questions about it.
Notification Switch
Would you like to follow the 'Mathematics grade 2' conversation and receive update notifications?

|
|

|
|

|
|

|
|

|
|

|
|

|
|

|
|
|
|
|

|