<< Chapter < Page Chapter >> Page >

Mathematics

Grade 9

Number patterns, graphs, equasions,

Statistics and probability

Module 12

Number patterns

ACTIVITY 1

To use a table to arrange information

[LO 2.1, 2.2]

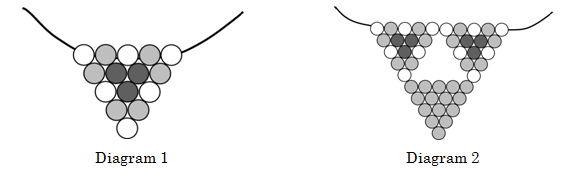
1. Alice is making necklaces by using triangular motifs that she places on a wire necklet (as shown in Diagram 1 below). Each motif is made from three black beads, six white beads and six coloured beads. It is important that she has the right number of beads of each colour. She wants to make 50 necklaces with black, white and red beads, 40 with black, white and yellow beads, 40 with black, white and blue beads and 30 with black, white and green beads.

Question: Calculate how many beads of each colour she has to buy.

2. She also combines three of these motifs in a bigger necklace (as shown in Diagram 2 above). The two top motifs in each necklace have the same design as before, but the bottom motif is made of 15 coloured beads only. She makes only half as many of these necklaces in each colour as she makes of the smaller necklaces referred to in Question 1.

Question: How many beads of each colour will she need for these necklaces?

3. She finds that the bigger necklaces are very popular, so she decides to use bigger motifs, and to combine more motifs in one necklace. The ne x t two diagrams show her new plans.

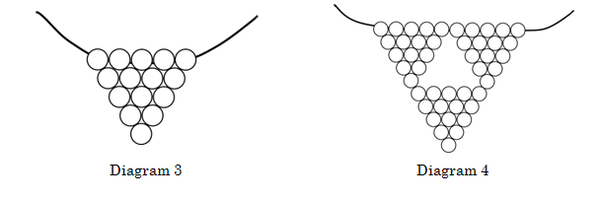
Alice wants to use four colours in these motifs. Use the diagram above to make your own four-colour design.

Question: Repeat the calculation exercises above for these necklaces.

4. These triangular motifs can be made larger and larger, of course. Not all of them are suitable for necklaces though!

Exercise: Below you see equilateral triangular Motifs 1 to 4. Draw Motifs 6 and 7 in the same sequence.

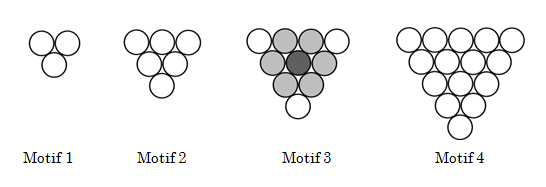
The Motif 3 above has 1 black bead, 3 white beads and si x red beads. You will need to refer to it in problem 6 below.

5. Data gathering: The beads in the motifs have a diameter of 1 cm each. Thus, the surrounding triangle in Motif 1 in the sequence has a side length of 2 cm. Complete the table below by referring to the triangles above as well as the ones you have drawn.

Side length of triangle in centimetres 2 3 4 5 6 7 8
Number of beads per triangle 3 6 10
Perimeter of triangle 6 9

6. Investigation: Alice makes her necklaces by combining triangular motifs as in diagrams 2 and 4. She uses the 10-bead motifs (Motif 3). The smallest necklace has one motif (size 1) and the next necklace has three motifs (size 2) with a triangular gap in the middle. Visualise the next sizes (3, 4, etc) of the necklaces (or draw them) and complete the table below. Try to complete the last column as well.

Size of necklace 1 2 3 4 5 X
Number of triangular motifs 6 10
Number of triangular spaces
Number of beads on each side of triangular motif
Total number of beads in necklace
Number of black beads
Total perimeter of pendant with 1 cm-diameter beads 9

7. Investigation: Do the same for the next table, if Alice now uses the 15-bead motif that we saw in the very first diagram.

Size of necklace 1 2 3 4 5 x
Number of triangular motifs 1 3
Number of triangular spaces 0 1
Number of beads on each side of triangular motif 5 10
Total number of beads in necklace 15 45
Number of black beads 3 9
Total perimeter of pendant with 1 cm-diameter beads 12 27

Questions & Answers

What is inflation
Bright Reply
a general and ongoing rise in the level of prices in an economy
AI-Robot
What are the factors that affect demand for a commodity
Florence Reply
price
Kenu
differentiate between demand and supply giving examples
Lambiv Reply
differentiated between demand and supply using examples
Lambiv
what is labour ?
Lambiv
how will I do?
Venny Reply
how is the graph works?I don't fully understand
Rezat Reply
information
Eliyee
devaluation
Eliyee
t
WARKISA
hi guys good evening to all
Lambiv
multiple choice question
Aster Reply
appreciation
Eliyee
explain perfect market
Lindiwe Reply
In economics, a perfect market refers to a theoretical construct where all participants have perfect information, goods are homogenous, there are no barriers to entry or exit, and prices are determined solely by supply and demand. It's an idealized model used for analysis,
Ezea
What is ceteris paribus?
Shukri Reply
other things being equal
AI-Robot
When MP₁ becomes negative, TP start to decline. Extuples Suppose that the short-run production function of certain cut-flower firm is given by: Q=4KL-0.6K2 - 0.112 • Where is quantity of cut flower produced, I is labour input and K is fixed capital input (K-5). Determine the average product of lab
Kelo
Extuples Suppose that the short-run production function of certain cut-flower firm is given by: Q=4KL-0.6K2 - 0.112 • Where is quantity of cut flower produced, I is labour input and K is fixed capital input (K-5). Determine the average product of labour (APL) and marginal product of labour (MPL)
Kelo
yes,thank you
Shukri
Can I ask you other question?
Shukri
what is monopoly mean?
Habtamu Reply
What is different between quantity demand and demand?
Shukri Reply
Quantity demanded refers to the specific amount of a good or service that consumers are willing and able to purchase at a give price and within a specific time period. Demand, on the other hand, is a broader concept that encompasses the entire relationship between price and quantity demanded
Ezea
ok
Shukri
how do you save a country economic situation when it's falling apart
Lilia Reply
what is the difference between economic growth and development
Fiker Reply
Economic growth as an increase in the production and consumption of goods and services within an economy.but Economic development as a broader concept that encompasses not only economic growth but also social & human well being.
Shukri
production function means
Jabir
What do you think is more important to focus on when considering inequality ?
Abdisa Reply
any question about economics?
Awais Reply
sir...I just want to ask one question... Define the term contract curve? if you are free please help me to find this answer 🙏
Asui
it is a curve that we get after connecting the pareto optimal combinations of two consumers after their mutually beneficial trade offs
Awais
thank you so much 👍 sir
Asui
In economics, the contract curve refers to the set of points in an Edgeworth box diagram where both parties involved in a trade cannot be made better off without making one of them worse off. It represents the Pareto efficient allocations of goods between two individuals or entities, where neither p
Cornelius
In economics, the contract curve refers to the set of points in an Edgeworth box diagram where both parties involved in a trade cannot be made better off without making one of them worse off. It represents the Pareto efficient allocations of goods between two individuals or entities,
Cornelius
Suppose a consumer consuming two commodities X and Y has The following utility function u=X0.4 Y0.6. If the price of the X and Y are 2 and 3 respectively and income Constraint is birr 50. A,Calculate quantities of x and y which maximize utility. B,Calculate value of Lagrange multiplier. C,Calculate quantities of X and Y consumed with a given price. D,alculate optimum level of output .
Feyisa Reply
Answer
Feyisa
c
Jabir
Got questions? Join the online conversation and get instant answers!
Jobilize.com Reply

Get Jobilize Job Search Mobile App in your pocket Now!

Get it on Google Play Download on the App Store Now


Source:  OpenStax, Mathematics grade 9. OpenStax CNX. Sep 14, 2009 Download for free at http://cnx.org/content/col11056/1.1
Google Play and the Google Play logo are trademarks of Google Inc.

Notification Switch

Would you like to follow the 'Mathematics grade 9' conversation and receive update notifications?

Ask