Fill in the blanks for the following sentence. Since the data consist of the numbers 1, 2, 3, and the starting point is 0.5, a width of one places the 1 in the middle of the interval 0.5 to _____, the 2 in the middle of the interval from _____ to _____, and the 3 in the middle of the interval from _____ to _____.
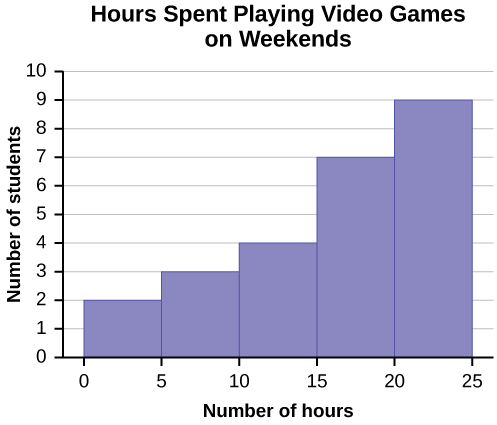
Number of Hours My Classmates Spent Playing Video Games on Weekends
9.95
10
2.25
16.75
0
19.5
22.5
7.5
15
12.75
5.5
11
10
20.75
17.5
23
21.9
24
23.75
18
20
15
22.9
18.8
20.5
Some values in this data set fall on boundaries for the class intervals. A value is counted in a class interval if it falls on the left boundary, but not if it falls on the right boundary. Different researchers may set up histograms for the same data in different ways. There is more than one correct way to set up a histogram.
Count the money (bills and change) in your pocket or purse. Your instructor will record the amounts. As a class, construct a histogram displaying the data. Discuss how many intervals you think is appropriate. You may want to experiment with the number of intervals.
Frequency polygons
Frequency polygons are analogous to line graphs, and just as line graphs make continuous data visually easy to interpret, so too do frequency polygons.
To construct a frequency polygon, first examine the data and decide on the number of intervals, or class intervals, to use on the
x -axis and
y -axis. After choosing the appropriate ranges, begin plotting the data points. After all the points are plotted, draw line segments to connect them.
A frequency polygon was constructed from the frequency table below.
Frequency Distribution for Calculus Final Test Scores
Lower Bound
Upper Bound
Frequency
Cumulative Frequency
49.5
59.5
5
5
59.5
69.5
10
15
69.5
79.5
30
45
79.5
89.5
40
85
89.5
99.5
15
100
The first label on the
x -axis is 44.5. This represents an interval extending from 39.5 to 49.5. Since the lowest test score is 54.5, this interval is used only to allow the graph to touch the
x -axis. The point labeled 54.5 represents the next interval, or the first “real” interval from the table, and contains five scores. This reasoning is followed for each of the remaining intervals with the point 104.5 representing the interval from 99.5 to 109.5. Again, this interval contains no data and is only used so that the graph will touch the
x -axis. Looking at the graph, we say that this distribution is skewed because one side of the graph does not mirror the other side.
Three charges q_{1}=+3\mu C, q_{2}=+6\mu C and q_{3}=+8\mu C are located at (2,0)m (0,0)m and (0,3) coordinates respectively. Find the magnitude and direction acted upon q_{2} by the two other charges.Draw the correct graphical illustration of the problem above showing the direction of all forces.
To solve this problem, we need to first find the net force acting on charge q_{2}. The magnitude of the force exerted by q_{1} on q_{2} is given by F=\frac{kq_{1}q_{2}}{r^{2}} where k is the Coulomb constant, q_{1} and q_{2} are the charges of the particles, and r is the distance between them.
Muhammed
What is the direction and net electric force on q_{1}= 5µC located at (0,4)r due to charges q_{2}=7mu located at (0,0)m and q_{3}=3\mu C located at (4,0)m?
Capacitor is a separation of opposite charges using an insulator of very small dimension between them. Capacitor is used for allowing an AC (alternating current) to pass while a DC (direct current) is blocked.
Gautam
A motor travelling at 72km/m on sighting a stop sign applying the breaks such that under constant deaccelerate in the meters of 50 metres what is the magnitude of the accelerate
velocity can be 72 km/h in question. 72 km/h=20 m/s, v^2=2.a.x , 20^2=2.a.50, a=4 m/s^2.
Mehmet
A boat travels due east at a speed of 40meter per seconds across a river flowing due south at 30meter per seconds. what is the resultant speed of the boat
which has a higher temperature, 1cup of boiling water or 1teapot of boiling water which can transfer more heat 1cup of boiling water or 1 teapot of boiling water explain your . answer
I believe temperature being an intensive property does not change for any amount of boiling water whereas heat being an extensive property changes with amount/size of the system.
Someone
Scratch that
Someone
temperature for any amount of water to boil at ntp is 100⁰C (it is a state function and and intensive property) and it depends both will give same amount of heat because the surface available for heat transfer is greater in case of the kettle as well as the heat stored in it but if you talk.....
Someone
about the amount of heat stored in the system then in that case since the mass of water in the kettle is greater so more energy is required to raise the temperature b/c more molecules of water are present in the kettle
pratica A on solution of hydro chloric acid,B is a solution containing 0.5000 mole ofsodium chlorid per dm³,put A in the burret and titrate 20.00 or 25.00cm³ portion of B using melting orange as the indicator. record the deside of your burret tabulate the burret reading and calculate the average volume of acid used?
No. According to Isac Newtons law. this two bodies maybe you and the wall beside you.
Attracting depends on the mass och each body and distance between them.
Dlovan
Are you really asking if two bodies have to be charged to be influenced by Coulombs Law?
Specific heat capacity is a measure of the amount of energy required to raise the temperature of a substance by one degree Celsius (or Kelvin). It is measured in Joules per kilogram per degree Celsius (J/kg°C).
AI-Robot
specific heat capacity is the amount of energy needed to raise the temperature of a substance by one degree Celsius or kelvin
ROKEEB
Got questions? Join the online conversation and get instant answers!