<< Chapter < Page Chapter >> Page >

The smallest data value is 60. Since the data with the most decimal places has one decimal (for instance, 61.5), we want our starting point to have two decimal places. Since the numbers 0.5, 0.05, 0.005, etc. are convenient numbers, use 0.05 and subtract it from 60, the smallest value, for the convenient starting point.

60 – 0.05 = 59.95 which is more precise than, say, 61.5 by one decimal place. The starting point is, then, 59.95.

The largest value is 74, so 74 + 0.05 = 74.05 is the ending value.

Next, calculate the width of each bar or class interval. To calculate this width, subtract the starting point from the ending value and divide by the number of bars (you must choose the number of bars you desire). Suppose you choose eight bars.

74.05 59.95 8 1.76

Note

We will round up to two and make each bar or class interval two units wide. Rounding up to two is one way to prevent a value from falling on a boundary. Rounding to the next number is often necessary even if it goes against the standard rules of rounding. For this example, using 1.76 as the width would also work. A guideline that is followed by some for the width of a bar or class interval is to take the square root of the number of data values and then round to the nearest whole number, if necessary. For example, if there are 150 values of data, take the square root of 150 and round to 12 bars or intervals.

The boundaries are:

  • 59.95
  • 59.95 + 2 = 61.95
  • 61.95 + 2 = 63.95
  • 63.95 + 2 = 65.95
  • 65.95 + 2 = 67.95
  • 67.95 + 2 = 69.95
  • 69.95 + 2 = 71.95
  • 71.95 + 2 = 73.95
  • 73.95 + 2 = 75.95

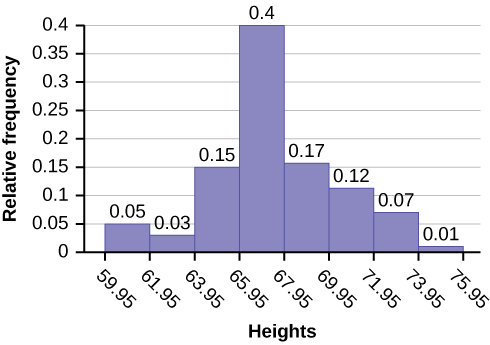
The heights 60 through 61.5 inches are in the interval 59.95–61.95. The heights that are 63.5 are in the interval 61.95–63.95. The heights that are 64 through 64.5 are in the interval 63.95–65.95. The heights 66 through 67.5 are in the interval 65.95–67.95. The heights 68 through 69.5 are in the interval 67.95–69.95. The heights 70 through 71 are in the interval 69.95–71.95. The heights 72 through 73.5 are in the interval 71.95–73.95. The height 74 is in the interval 73.95–75.95.

The following histogram displays the heights on the x -axis and relative frequency on the y -axis.

Histogram consists of 8 bars with the y-axis in increments of 0.05 from 0-0.4 and the x-axis in intervals of 2 from 59.95-75.95.

Try it

The following data are the shoe sizes of 50 male students. The sizes are continuous data since shoe size is measured. Construct a histogram and calculate the width of each bar or class interval. Suppose you choose six bars.
9; 9; 9.5; 9.5; 10; 10; 10; 10; 10; 10; 10.5; 10.5; 10.5; 10.5; 10.5; 10.5; 10.5; 10.5
11; 11; 11; 11; 11; 11; 11; 11; 11; 11; 11; 11; 11; 11.5; 11.5; 11.5; 11.5; 11.5; 11.5; 11.5
12; 12; 12; 12; 12; 12; 12; 12.5; 12.5; 12.5; 12.5; 14

Smallest value: 9

Largest value: 14

Convenient starting value: 9 – 0.05 = 8.95

Convenient ending value: 14 + 0.05 = 14.05

14.05 8.95 6 = 0.85

The calculations suggests using 0.85 as the width of each bar or class interval. You can also use an interval with a width equal to one.

Got questions? Get instant answers now!

The following data are the number of books bought by 50 part-time college students at ABC College. The number of books is discrete data , since books are counted.
1; 1; 1; 1; 1; 1; 1; 1; 1; 1; 1
2; 2; 2; 2; 2; 2; 2; 2; 2; 2
3; 3; 3; 3; 3; 3; 3; 3; 3; 3; 3; 3; 3; 3; 3; 3
4; 4; 4; 4; 4; 4
5; 5; 5; 5; 5
6; 6

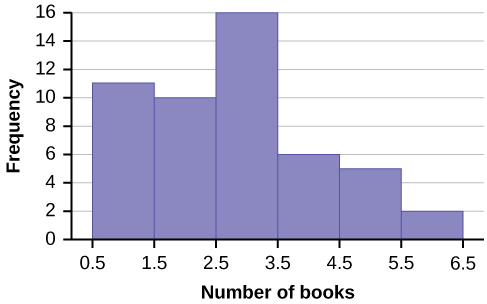
Eleven students buy one book. Ten students buy two books. Sixteen students buy three books. Six students buy four books. Five students buy five books. Two students buy six books.

Because the data are integers, subtract 0.5 from 1, the smallest data value and add 0.5 to 6, the largest data value. Then the starting point is 0.5 and the ending value is 6.5.

Next, calculate the width of each bar or class interval. If the data are discrete and there are not too many different values, a width that places the data values in the middle of the bar or class interval is the most convenient. Since the data consist of the numbers 1, 2, 3, 4, 5, 6, and the starting point is 0.5, a width of one places the 1 in the middle of the interval from 0.5 to 1.5, the 2 in the middle of the interval from 1.5 to 2.5, the 3 in the middle of the interval from 2.5 to 3.5, the 4 in the middle of the interval from _______ to _______, the 5 in the middle of the interval from _______ to _______, and the _______ in the middle of the interval from _______ to _______ .

  • 3.5 to 4.5
  • 4.5 to 5.5
  • 6
  • 5.5 to 6.5
Got questions? Get instant answers now!

Calculate the number of bars as follows:

6.5 0.5 number of bars 1

where 1 is the width of a bar. Therefore, bars = 6.

The following histogram displays the number of books on the x -axis and the frequency on the y -axis.

Histogram consists of 6 bars with the y-axis in increments of 2 from 0-16 and the x-axis in intervals of 1 from 0.5-6.5.
Got questions? Get instant answers now!

Questions & Answers

What is inflation
Bright Reply
a general and ongoing rise in the level of prices in an economy
AI-Robot
What are the factors that affect demand for a commodity
Florence Reply
price
Kenu
differentiate between demand and supply giving examples
Lambiv Reply
differentiated between demand and supply using examples
Lambiv
what is labour ?
Lambiv
how will I do?
Venny Reply
how is the graph works?I don't fully understand
Rezat Reply
information
Eliyee
devaluation
Eliyee
t
WARKISA
hi guys good evening to all
Lambiv
multiple choice question
Aster Reply
appreciation
Eliyee
explain perfect market
Lindiwe Reply
In economics, a perfect market refers to a theoretical construct where all participants have perfect information, goods are homogenous, there are no barriers to entry or exit, and prices are determined solely by supply and demand. It's an idealized model used for analysis,
Ezea
What is ceteris paribus?
Shukri Reply
other things being equal
AI-Robot
When MP₁ becomes negative, TP start to decline. Extuples Suppose that the short-run production function of certain cut-flower firm is given by: Q=4KL-0.6K2 - 0.112 • Where is quantity of cut flower produced, I is labour input and K is fixed capital input (K-5). Determine the average product of lab
Kelo
Extuples Suppose that the short-run production function of certain cut-flower firm is given by: Q=4KL-0.6K2 - 0.112 • Where is quantity of cut flower produced, I is labour input and K is fixed capital input (K-5). Determine the average product of labour (APL) and marginal product of labour (MPL)
Kelo
yes,thank you
Shukri
Can I ask you other question?
Shukri
what is monopoly mean?
Habtamu Reply
What is different between quantity demand and demand?
Shukri Reply
Quantity demanded refers to the specific amount of a good or service that consumers are willing and able to purchase at a give price and within a specific time period. Demand, on the other hand, is a broader concept that encompasses the entire relationship between price and quantity demanded
Ezea
ok
Shukri
how do you save a country economic situation when it's falling apart
Lilia Reply
what is the difference between economic growth and development
Fiker Reply
Economic growth as an increase in the production and consumption of goods and services within an economy.but Economic development as a broader concept that encompasses not only economic growth but also social & human well being.
Shukri
production function means
Jabir
What do you think is more important to focus on when considering inequality ?
Abdisa Reply
any question about economics?
Awais Reply
sir...I just want to ask one question... Define the term contract curve? if you are free please help me to find this answer 🙏
Asui
it is a curve that we get after connecting the pareto optimal combinations of two consumers after their mutually beneficial trade offs
Awais
thank you so much 👍 sir
Asui
In economics, the contract curve refers to the set of points in an Edgeworth box diagram where both parties involved in a trade cannot be made better off without making one of them worse off. It represents the Pareto efficient allocations of goods between two individuals or entities, where neither p
Cornelius
In economics, the contract curve refers to the set of points in an Edgeworth box diagram where both parties involved in a trade cannot be made better off without making one of them worse off. It represents the Pareto efficient allocations of goods between two individuals or entities,
Cornelius
Suppose a consumer consuming two commodities X and Y has The following utility function u=X0.4 Y0.6. If the price of the X and Y are 2 and 3 respectively and income Constraint is birr 50. A,Calculate quantities of x and y which maximize utility. B,Calculate value of Lagrange multiplier. C,Calculate quantities of X and Y consumed with a given price. D,alculate optimum level of output .
Feyisa Reply
Answer
Feyisa
c
Jabir
Got questions? Join the online conversation and get instant answers!
Jobilize.com Reply

Get Jobilize Job Search Mobile App in your pocket Now!

Get it on Google Play Download on the App Store Now


Source:  OpenStax, Introductory statistics. OpenStax CNX. May 06, 2016 Download for free at http://legacy.cnx.org/content/col11562/1.18
Google Play and the Google Play logo are trademarks of Google Inc.

Notification Switch

Would you like to follow the 'Introductory statistics' conversation and receive update notifications?

Ask