

| << Chapter < Page | Chapter >> Page > |
The number of same-sex couples has grown significantly in the past decade. The U.S. Census Bureau reported 594,000 same-sex couple households in the United States, a 50 percent increase from 2000. This increase is a result of more coupling, the growing social acceptance of homosexuality, and a subsequent increase in willingness to report it. Nationally, same-sex couple households make up 1 percent of the population, ranging from as little as 0.29 percent in Wyoming to 4.01 percent in the District of Columbia (U.S. Census 2011). Legal recognition of same-sex couples as spouses is different in each state, as only six states and the District of Columbia have legalized same-sex marriage. The 2010 U.S. Census, however, allowed same-sex couples to report as spouses regardless of whether their state legally recognizes their relationship. Nationally, 25 percent of all same-sex households reported that they were spouses. In states where same-sex marriages are performed, nearly half (42.4 percent) of same-sex couple households were reported as spouses.
In terms of demographics, same-sex couples are not very different from opposite-sex couples. Same-sex couple households have an average age of 52 and an average household income of $91,558; opposite-sex couple households have an average age of 59 and an average household income of $95,075. Additionally, 31 percent of same-sex couples are raising children, not far from the 43 percent of opposite-sex couples (U.S. Census 2009). Of the children in same-sex couple households, 73 percent are biological children (of only one of the parents), 21 percent are adopted only, and 6 percent are a combination of biological and adopted (U.S. Census 2009).
While there is some concern from socially conservative groups regarding the well-being of children who grow up in same-sex households, research reports that same-sex parents are as effective as opposite-sex parents. In an analysis of 81 parenting studies, sociologists found no quantifiable data to support the notion that opposite-sex parenting is any better than same-sex parenting. Children of lesbian couples, however, were shown to have slightly lower rates of behavioral problems and higher rates of self-esteem (Biblarz and Stacey 2010).
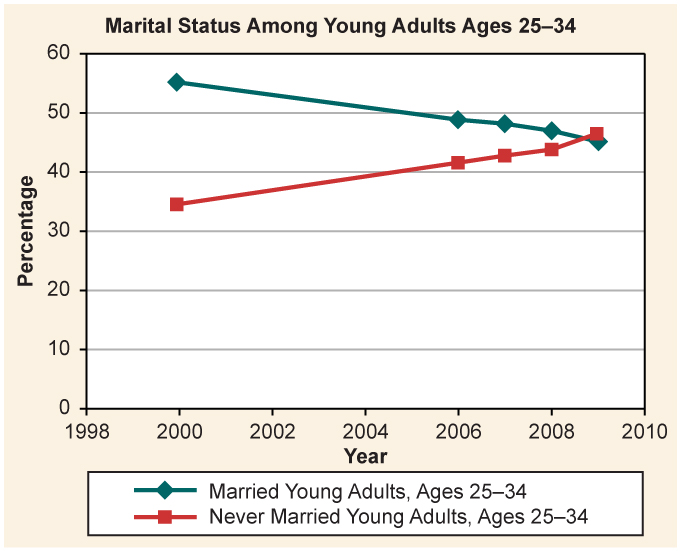
Gay or straight, a new option for many people in the United States is simply to stay single. In 2010, there were 99.6 million unmarried individuals over age eighteen in the United States, accounting for 44 percent of the total adult population (U.S. Census 2011). In 2010, never-married individuals in the twenty-five to twenty-nine age bracket accounted for 62 percent of women and 48 percent of men, up from 11 percent and 19 percent, respectively, in 1970 (U.S. Census 2011). Single, or never-married, individuals are found in higher concentrations in large cities or metropolitan areas, with New York City being one of the highest.
Notification Switch
Would you like to follow the 'Introduction to sociology 2e' conversation and receive update notifications?

|
|
|
|
|

|
|

|
|

|
|

|
|

|
|

|
|

|
|

|
|

|
|
|
|