<< Chapter < Page Chapter >> Page >
Schematic representation of the chromatographic process. Adapted from Harold M. McNair, James M. Miller, Basic Gas Chromatography , John Wiley&Sons, New York,1998. Reproduced courtesy of John Wiley&Sons, Inc.

A typical chromatogram

[link] shows a chromatogram of the analysis of residual methanol in biodiesel, which is one of the required properties that must be measured to ensure the quality of the product at the time and place of delivery.

Chromatogram of the analysis of methanol in B100 biodiesel, following EN 14110 methodology. Reproduced courtesy of PerkinElmer Inc. (http://www.perkinelmer.com/)

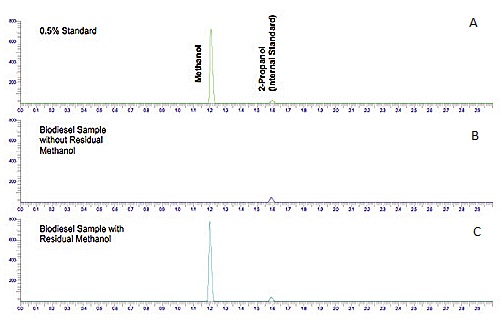
Chromatogram ( [link] a) shows a standard solution of methanol with 2-propanol as the internal standard. From the figure it can be seen that methanol has a higher affinity for the mobile phase (lower K c ) than 2-propanol (iso-propanol), and therefore elutes first. Chromatograms ( [link] b and c) show two samples of biodiesel, one with methanol ( [link] b) and another with no methanol detection. The internal standard was added to both samples for quantitation purposes.

Instrument overview

Components of a gas chromatograph system

[link] shows a schematic diagram of the components of a typical gas chromatograph, while [link] shows a photograph of a typical gas chromatograph coupled to a mass spectrometer (GC/MS).

Schematic diagram of the components of a typical gas chromatograph. Adapted from http://en.wikipedia.org/wiki/Gas_chromatography
Image of a Perkin Elmer Clarus SQ 8S GC/MS. Reproduced courtesy of PerkinElmer Inc. ( (External Link) ).

Carrier gas

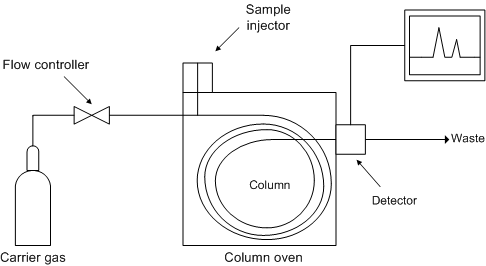
The role of the carrier gas -GC mobile phase- is to carry the sample molecules along the column while they are not dissolved in or adsorbed on the stationary phase. The carrier gas is inert and does not interact with the sample, and thus GC separation's selectivity can be attributed to the stationary phase alone. However, the choice of carrier gas is important to maintain high efficiency. The effect of different carrier gases on column efficiency is represented by the van Deemter (packed columns) and the Golay equation (capillary columns). The van Deemter equation, [link] , describes the three main effects that contribute to band broadening in packed columns and, as a consequence, to a reduced efficiency in the separation process.

These three factors are:

  1. the eddy diffusion (the A-term), which results from the fact that in packed columns spaces between particles along the column are not uniform. Therefore, some molecules take longer pathways than others, and there are also variations in the velocity of the mobile phase.
  2. the longitudinal molecular diffusion (the B-term) which is a consequence of having regions with different analyte concentrations.
  3. the mass transfer in the stationary liquid phase (the C-term)

The broadening is described in terms of the height equivalent to a theoretical plate, HEPT, as a function of the average linear gas velocity, u . A small HEPT value indicates a narrow peak and a higher efficiency.

Since capillary columns do not have any packing, the Golay equation, [link] , does not have an A-term. The Golay equation has 2 C-terms, one for mass transfer in then stationary phase (C s ) and one for mass transfer in the mobile phase (C M ).

Questions & Answers

Examine the distinction between theory of comparative cost Advantage and theory of factor proportion
Fatima Reply
What is inflation
Bright Reply
a general and ongoing rise in the level of prices in an economy
AI-Robot
What are the factors that affect demand for a commodity
Florence Reply
price
Kenu
differentiate between demand and supply giving examples
Lambiv Reply
differentiated between demand and supply using examples
Lambiv
what is labour ?
Lambiv
how will I do?
Venny Reply
how is the graph works?I don't fully understand
Rezat Reply
information
Eliyee
devaluation
Eliyee
t
WARKISA
hi guys good evening to all
Lambiv
multiple choice question
Aster Reply
appreciation
Eliyee
explain perfect market
Lindiwe Reply
In economics, a perfect market refers to a theoretical construct where all participants have perfect information, goods are homogenous, there are no barriers to entry or exit, and prices are determined solely by supply and demand. It's an idealized model used for analysis,
Ezea
What is ceteris paribus?
Shukri Reply
other things being equal
AI-Robot
When MP₁ becomes negative, TP start to decline. Extuples Suppose that the short-run production function of certain cut-flower firm is given by: Q=4KL-0.6K2 - 0.112 • Where is quantity of cut flower produced, I is labour input and K is fixed capital input (K-5). Determine the average product of lab
Kelo
Extuples Suppose that the short-run production function of certain cut-flower firm is given by: Q=4KL-0.6K2 - 0.112 • Where is quantity of cut flower produced, I is labour input and K is fixed capital input (K-5). Determine the average product of labour (APL) and marginal product of labour (MPL)
Kelo
yes,thank you
Shukri
Can I ask you other question?
Shukri
what is monopoly mean?
Habtamu Reply
What is different between quantity demand and demand?
Shukri Reply
Quantity demanded refers to the specific amount of a good or service that consumers are willing and able to purchase at a give price and within a specific time period. Demand, on the other hand, is a broader concept that encompasses the entire relationship between price and quantity demanded
Ezea
ok
Shukri
how do you save a country economic situation when it's falling apart
Lilia Reply
what is the difference between economic growth and development
Fiker Reply
Economic growth as an increase in the production and consumption of goods and services within an economy.but Economic development as a broader concept that encompasses not only economic growth but also social & human well being.
Shukri
production function means
Jabir
What do you think is more important to focus on when considering inequality ?
Abdisa Reply
any question about economics?
Awais Reply
sir...I just want to ask one question... Define the term contract curve? if you are free please help me to find this answer 🙏
Asui
it is a curve that we get after connecting the pareto optimal combinations of two consumers after their mutually beneficial trade offs
Awais
thank you so much 👍 sir
Asui
In economics, the contract curve refers to the set of points in an Edgeworth box diagram where both parties involved in a trade cannot be made better off without making one of them worse off. It represents the Pareto efficient allocations of goods between two individuals or entities, where neither p
Cornelius
In economics, the contract curve refers to the set of points in an Edgeworth box diagram where both parties involved in a trade cannot be made better off without making one of them worse off. It represents the Pareto efficient allocations of goods between two individuals or entities,
Cornelius
Got questions? Join the online conversation and get instant answers!
Jobilize.com Reply

Get Jobilize Job Search Mobile App in your pocket Now!

Get it on Google Play Download on the App Store Now


Source:  OpenStax, Physical methods in chemistry and nano science. OpenStax CNX. May 05, 2015 Download for free at http://legacy.cnx.org/content/col10699/1.21
Google Play and the Google Play logo are trademarks of Google Inc.

Notification Switch

Would you like to follow the 'Physical methods in chemistry and nano science' conversation and receive update notifications?

Ask