<< Chapter < Page Chapter >> Page >
[ p + a ( n V ) 2 ] ( V n b ) = n R T .

In the limit of low density (small n ), the a and b terms are negligible, and we have the ideal gas law, as we should for low density. On the other hand, if V n b is small, meaning that the molecules are very close together, the pressure must be higher to give the same nRT , as we would expect in the situation of a highly compressed gas. However, the increase in pressure is less than that argument would suggest, because at high density the ( n / V ) 2 term is significant. Since it’s positive, it causes a lower pressure to give the same nRT .

The van der Waals equation of state works well for most gases under a wide variety of conditions. As we’ll see in the next module, it even predicts the gas-liquid transition.

pV Diagrams

We can examine aspects of the behavior of a substance by plotting a pV diagram    , which is a graph of pressure versus volume. When the substance behaves like an ideal gas, the ideal gas law p V = n R T describes the relationship between its pressure and volume. On a pV diagram, it’s common to plot an isotherm , which is a curve showing p as a function of V with the number of molecules and the temperature fixed. Then, for an ideal gas, p V = constant . For example, the volume of the gas decreases as the pressure increases. The resulting graph is a hyperbola.

However, if we assume the van der Waals equation of state, the isotherms become more interesting, as shown in [link] . At high temperatures, the curves are approximately hyperbolas, representing approximately ideal behavior at various fixed temperatures. At lower temperatures, the curves look less and less like hyperbolas—that is, the gas is not behaving ideally. There is a critical temperature     T c at which the curve has a point with zero slope. Below that temperature, the curves do not decrease monotonically; instead, they each have a “hump,” meaning that for a certain range of volume, increasing the volume increases the pressure.

The figure is a plot of Pressure, p, on the vertical axis as a function of volume, V, on the horizontal axis, at five different temperatures. The curves all start at high pressures for the lowest volumes and decrease. The upper two curves, in red, decrease monotonically, with gradually decreasing slope. These curves are marked as having T greater than T c. The middle curve, in purple, is marked T c. This curve decreases rapidly, has a saddle point, and then continues to decrease gradually. The lowest two curves, in blue, decrease to a narrow minimum, then increase to a broad maximum, and then decrease gradually. These curves are marked as having T less than T c. The pressure minima of the lower curves occur at volumes slightly lower than the volume at which the T c curve saddle point is found.
pV diagram for a Van der Waals gas at various temperatures. The red curves are calculated at temperatures above the critical temperature and the blue curves at temperatures below it. The blue curves have an oscillation in which volume ( V ) increases with increasing temperature ( T ), an impossible situation, so they must be corrected as in [link] . (credit: “Eman”/Wikimedia Commons)

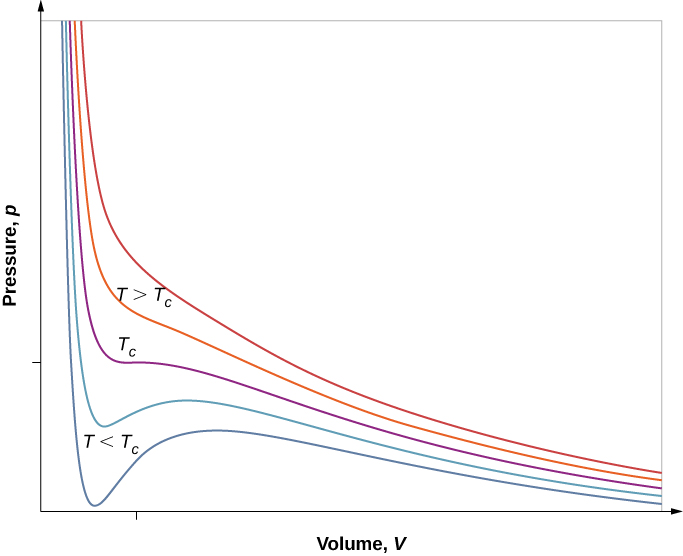
Such behavior would be completely unphysical. Instead, the curves are understood as describing a liquid-gas phase transition . The oscillating part of the curve is replaced by a horizontal line, showing that as the volume increases at constant temperature, the pressure stays constant. That behavior corresponds to boiling and condensation; when a substance is at its boiling temperature for a particular pressure, it can increase in volume as some of the liquid turns to gas, or decrease as some of the gas turns to liquid, without any change in temperature or pressure.

[link] shows similar isotherms that are more realistic than those based on the van der Waals equation. The steep parts of the curves to the left of the transition region show the liquid phase, which is almost incompressible—a slight decrease in volume requires a large increase in pressure. The flat parts show the liquid-gas transition; the blue regions that they define represent combinations of pressure and volume where liquid and gas can coexist.

Questions & Answers

What is inflation
Bright Reply
a general and ongoing rise in the level of prices in an economy
AI-Robot
What are the factors that affect demand for a commodity
Florence Reply
price
Kenu
differentiate between demand and supply giving examples
Lambiv Reply
differentiated between demand and supply using examples
Lambiv
what is labour ?
Lambiv
how will I do?
Venny Reply
how is the graph works?I don't fully understand
Rezat Reply
information
Eliyee
devaluation
Eliyee
t
WARKISA
hi guys good evening to all
Lambiv
multiple choice question
Aster Reply
appreciation
Eliyee
explain perfect market
Lindiwe Reply
In economics, a perfect market refers to a theoretical construct where all participants have perfect information, goods are homogenous, there are no barriers to entry or exit, and prices are determined solely by supply and demand. It's an idealized model used for analysis,
Ezea
What is ceteris paribus?
Shukri Reply
other things being equal
AI-Robot
When MP₁ becomes negative, TP start to decline. Extuples Suppose that the short-run production function of certain cut-flower firm is given by: Q=4KL-0.6K2 - 0.112 • Where is quantity of cut flower produced, I is labour input and K is fixed capital input (K-5). Determine the average product of lab
Kelo
Extuples Suppose that the short-run production function of certain cut-flower firm is given by: Q=4KL-0.6K2 - 0.112 • Where is quantity of cut flower produced, I is labour input and K is fixed capital input (K-5). Determine the average product of labour (APL) and marginal product of labour (MPL)
Kelo
yes,thank you
Shukri
Can I ask you other question?
Shukri
what is monopoly mean?
Habtamu Reply
What is different between quantity demand and demand?
Shukri Reply
Quantity demanded refers to the specific amount of a good or service that consumers are willing and able to purchase at a give price and within a specific time period. Demand, on the other hand, is a broader concept that encompasses the entire relationship between price and quantity demanded
Ezea
ok
Shukri
how do you save a country economic situation when it's falling apart
Lilia Reply
what is the difference between economic growth and development
Fiker Reply
Economic growth as an increase in the production and consumption of goods and services within an economy.but Economic development as a broader concept that encompasses not only economic growth but also social & human well being.
Shukri
production function means
Jabir
What do you think is more important to focus on when considering inequality ?
Abdisa Reply
any question about economics?
Awais Reply
sir...I just want to ask one question... Define the term contract curve? if you are free please help me to find this answer 🙏
Asui
it is a curve that we get after connecting the pareto optimal combinations of two consumers after their mutually beneficial trade offs
Awais
thank you so much 👍 sir
Asui
In economics, the contract curve refers to the set of points in an Edgeworth box diagram where both parties involved in a trade cannot be made better off without making one of them worse off. It represents the Pareto efficient allocations of goods between two individuals or entities, where neither p
Cornelius
In economics, the contract curve refers to the set of points in an Edgeworth box diagram where both parties involved in a trade cannot be made better off without making one of them worse off. It represents the Pareto efficient allocations of goods between two individuals or entities,
Cornelius
Suppose a consumer consuming two commodities X and Y has The following utility function u=X0.4 Y0.6. If the price of the X and Y are 2 and 3 respectively and income Constraint is birr 50. A,Calculate quantities of x and y which maximize utility. B,Calculate value of Lagrange multiplier. C,Calculate quantities of X and Y consumed with a given price. D,alculate optimum level of output .
Feyisa Reply
Answer
Feyisa
c
Jabir
Got questions? Join the online conversation and get instant answers!
Jobilize.com Reply

Get Jobilize Job Search Mobile App in your pocket Now!

Get it on Google Play Download on the App Store Now


Source:  OpenStax, University physics volume 2. OpenStax CNX. Oct 06, 2016 Download for free at http://cnx.org/content/col12074/1.3
Google Play and the Google Play logo are trademarks of Google Inc.

Notification Switch

Would you like to follow the 'University physics volume 2' conversation and receive update notifications?

Ask