<< Chapter < Page Chapter >> Page >

Learning objectives

By the end of this section, you will be able to:

  • Explain equipotential lines (also called isolines of electric potential) and equipotential surfaces.
  • Describe the action of grounding an electrical appliance.
  • Compare electric field and equipotential lines.

The information presented in this section supports the following AP® learning objectives and science practices:

  • 2.E.2.1 The student is able to determine the structure of isolines of electric potential by constructing them in a given electric field. (S.P. 6.4, 7.2)
  • 2.E.2.2 The student is able to predict the structure of isolines of electric potential by constructing them in a given electric field and make connections between these isolines and those found in a gravitational field. (S.P. 6.4, 7.2)
  • 2.E.2.3 The student is able to qualitatively use the concept of isolines to construct isolines of electric potential in an electric field and determine the effect of that field on electrically charged objects. (S.P. 1.4)

We can represent electric potentials (voltages) pictorially, just as we drew pictures to illustrate electric fields. Of course, the two are related. Consider [link] , which shows an isolated positive point charge and its electric field lines. Electric field lines radiate out from a positive charge and terminate on negative charges. While we use blue arrows to represent the magnitude and direction of the electric field, we use green lines to represent places where the electric potential is constant. These are called equipotential lines in two dimensions, or equipotential surfaces in three dimensions. The term equipotential is also used as a noun, referring to an equipotential line or surface. The potential for a point charge is the same anywhere on an imaginary sphere of radius r size 12{r} {} surrounding the charge. This is true since the potential for a point charge is given by V = kQ / r size 12{V= ital "kQ"/r} {} and, thus, has the same value at any point that is a given distance r size 12{r} {} from the charge. An equipotential sphere is a circle in the two-dimensional view of [link] . Since the electric field lines point radially away from the charge, they are perpendicular to the equipotential lines.

The figure shows a positive charge Q at the center of four concentric circles of increasing radii. The electric potential is the same along each of the circles, called equipotential lines. Straight lines representing electric field lines are drawn from the positive charge to intersect the circles at various points. The equipotential lines are perpendicular to the electric field lines.
An isolated point charge Q size 12{Q} {} with its electric field lines in blue and equipotential lines in green. The potential is the same along each equipotential line, meaning that no work is required to move a charge anywhere along one of those lines. Work is needed to move a charge from one equipotential line to another. Equipotential lines are perpendicular to electric field lines in every case.

Applying the science practices: electric potential and peaks

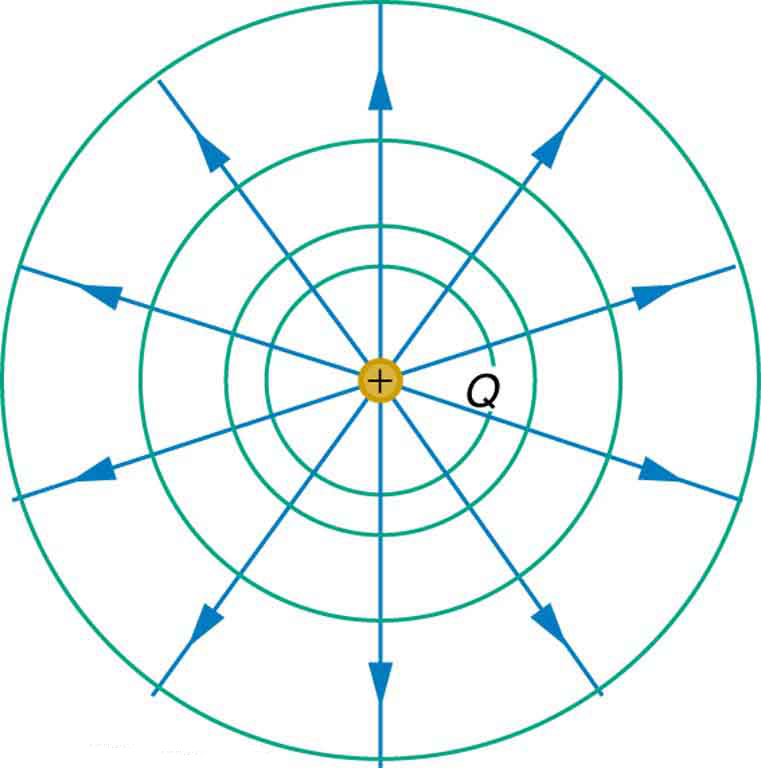
Starting with [link] as a rough example, draw diagrams of isolines for both positive and negative isolated point charges. Be sure to take care with what happens to the spacing of the isolines as you get closer to the charge. Then copy both of these sets of lines, but relabel them as gravitational equipotential lines. Then try to draw the sort of hill or hole or other shape that would have equipotential lines of this form. Does this shape exist in nature?

The topographical map has elevation lines spaced more or less equidistantly.
An example of a topographical map.

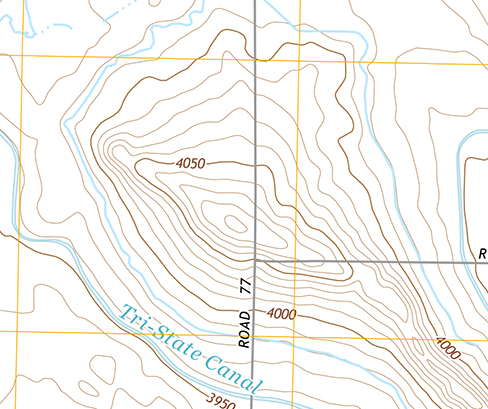
You should notice that the lines get closer together the closer you get to the point charge. The hill (or sinkhole, for the equivalent from a negative charge) should have a 1/ r sort of form, which is not a very common topographical feature.

Questions & Answers

how do you get the 2/50
Abba Reply
number of sport play by 50 student construct discrete data
Aminu Reply
width of the frangebany leaves on how to write a introduction
Theresa Reply
Solve the mean of variance
Veronica Reply
Step 1: Find the mean. To find the mean, add up all the scores, then divide them by the number of scores. ... Step 2: Find each score's deviation from the mean. ... Step 3: Square each deviation from the mean. ... Step 4: Find the sum of squares. ... Step 5: Divide the sum of squares by n – 1 or N.
kenneth
what is error
Yakuba Reply
Is mistake done to something
Vutshila
Hy
anas
hy
What is the life teble
anas
hy
Jibrin
statistics is the analyzing of data
Tajudeen Reply
what is statics?
Zelalem Reply
how do you calculate mean
Gloria Reply
diveving the sum if all values
Shaynaynay
let A1,A2 and A3 events be independent,show that (A1)^c, (A2)^c and (A3)^c are independent?
Fisaye Reply
what is statistics
Akhisani Reply
data collected all over the world
Shaynaynay
construct a less than and more than table
Imad Reply
The sample of 16 students is taken. The average age in the sample was 22 years with astandard deviation of 6 years. Construct a 95% confidence interval for the age of the population.
Aschalew Reply
Bhartdarshan' is an internet-based travel agency wherein customer can see videos of the cities they plant to visit. The number of hits daily is a normally distributed random variable with a mean of 10,000 and a standard deviation of 2,400 a. what is the probability of getting more than 12,000 hits? b. what is the probability of getting fewer than 9,000 hits?
Akshay Reply
Bhartdarshan'is an internet-based travel agency wherein customer can see videos of the cities they plan to visit. The number of hits daily is a normally distributed random variable with a mean of 10,000 and a standard deviation of 2,400. a. What is the probability of getting more than 12,000 hits
Akshay
1
Bright
Sorry i want to learn more about this question
Bright
Someone help
Bright
a= 0.20233 b=0.3384
Sufiyan
a
Shaynaynay
How do I interpret level of significance?
Mohd Reply
It depends on your business problem or in Machine Learning you could use ROC- AUC cruve to decide the threshold value
Shivam
how skewness and kurtosis are used in statistics
Owen Reply
yes what is it
Taneeya
Got questions? Join the online conversation and get instant answers!
Jobilize.com Reply
Practice Key Terms 2

Get Jobilize Job Search Mobile App in your pocket Now!

Get it on Google Play Download on the App Store Now


Source:  OpenStax, College physics for ap® courses. OpenStax CNX. Nov 04, 2016 Download for free at https://legacy.cnx.org/content/col11844/1.14
Google Play and the Google Play logo are trademarks of Google Inc.

Notification Switch

Would you like to follow the 'College physics for ap® courses' conversation and receive update notifications?

Ask