

| << Chapter < Page | Chapter >> Page > |
19.
a) 30
b) 40
c) 25
d) 35
e) 4 986
f) 2,51
g) 308
h) 71,2
i) 10
j) 40
k) 120
l) 1,743
m) 186
n) 1 528
o) 8,249
16. AREA OF IRREGULAR FIGURES
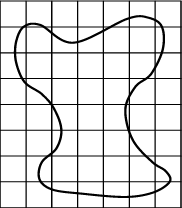
16.1 a) Work together with a friend. How will you determine the area of this figure? Assume that every square is 1 cm2.
_____________________________________________________________________
_____________________________________________________________________
_____________________________________________________________________
_____________________________________________________________________
b) Now use your method and determine the area!
_____________________________________________________________________
_____________________________________________________________________
_____________________________________________________________________
_____________________________________________________________________
16.2 Did you know?
With irregular figures, we can only determine an approximate area. We do it by counting all the whole squares within the figure. We also count all the squares that are bigger than half a square and add it to the first total. The squares that are smaller than half a square are not counted. Can you give a reason for this?
_____________________________________________________________________
_____________________________________________________________________
_____________________________________________________________________
_____________________________________________________________________
This is how we express the approximate area in cm².
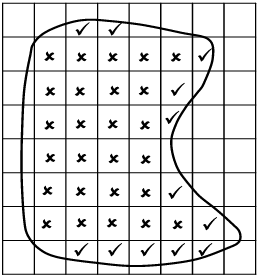
e.g.
Whole squares : 26
Squares bigger than half : 12
Approximate area :38 cm²
16.3 Now draw the outline of your hand on the squared paper below. Assume that each square is 1 cm².

a) Calculate the approximate area of your hand. __________________________
b) Which learner’s hand covered the biggest area? ________________________
c) Which learner’s hand covered the smallest area? ________________________
17 Time for self-assessment
|
Uncertain | Reasonably certain | Certain |
| I can explain the concept “area”. | |||
| I can convert cm² to mm² and vice versa. | |||
| I can convert m² tot cm² and vice versa. | |||
| I can convert km² to m² and vice versa. | |||
| I can convert m² to hectare and vice versa. | |||
| I know the formulas to determine the areas of the following figures: | |||
|
|||
|
|||
|
|||
| I can determine the area of regular figures. | |||
| I can determine the approximate areas of irregular figures. |
18.1 Let us play a game!
You need a friend, two dice, paper and a pencil. Player A is the “perimeter” and player B is the “area”. You are both “rectangles” and work in cm.
Player A throws the two dice and then works out the perimeter of a rectangle with the two numbers, e.g. 6 and 2.
(6 x 2) + (2 x 2) = 16 cm
Player B calculates the area with the same numbers: 6 x 2 = 12 cm2
The perimeter is greater, thus player A gets two points. Take turns. The player who gets the most points after 15 rounds is the winner.
18.2 CHALLENGE!
a) Look carefully at this example of a house plan.
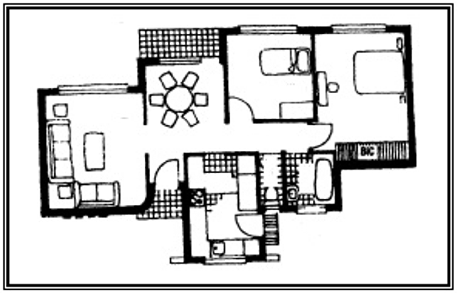
b) Now draw your own plan of a house as simply as possible.
c) What is the area of the floor surface of your house? _____________________
d) How big is your yard? ____________________________________________
e) What is the perimeter of your garage(s)? _____________________________
f) If you sell your house for half a million rand, what will the cost be per m²? _____________________________________________________________________
_____________________________________________________________________
g) If your parents build on another room 6,1 m by 3,5 m, what will the area of your house then be?
_____________________________________________________________________
_____________________________________________________________________
19. Let us now see if you can improve on the results of your previous mental test.
Complete the following as quickly and accurately as possible:
a) 0,6 of 50 = _______________________
b) 0,8 of 50 = _______________________
c) 50% of 50 = ______________________
d) 70% of 50 = ______________________
e) 4,986 x 1 000 = ___________________
f) 0,251 x 10 = ____________________
g) 3,08 x 100 = ______________________
h) 7,12 x 10 = ____________________
i) 25% x 40 = _______________________
j) 100% x 40 = ______________________
k) 300% x 40 = ______________________
l) 174,3 ÷ 100 = _____________________
m) 18,6 ÷ 0,1 = ______________________
n) 15,28 ÷ 0,01 = ____________________
o) 8 249 ÷ 1 000 = ___________________
Did you improve? ______________________
Learning Outcome 4: The learner will be able to use appropriate measuring units, instruments and formulae in a variety of contexts.
Assessment Standard 4.2: We know this when the learner solves problems;
Assessment Standard 4.5: We know this when the learner calculates, by selecting and using appropriate formulae.
Learning Outcome 1: The learner will be able to recognise, describe and represent numbers and their relationships, and to count, estimate, calculate and check with competence and confidence in solving problems.
Assessment Standard 1.8: We know this when the learner performs mental calculations involving squares of natural numbers to at least 10 2 and cubes of natural numbers to at least 5 ³ .
Notification Switch
Would you like to follow the 'Mathematics grade 7' conversation and receive update notifications?

|
|

|
|

|
|

|
|

|
|

|
|

|
|

|
|

|
|

|