<< Chapter < Page Chapter >> Page >

ε = the Greek letter epsilon

For each data point, you can calculate the residuals or errors, y i - y ^ i = ε i for i = 1, 2, 3, ..., 11 .

Each | ε | is a vertical distance.

For the example about the third exam scores and the final exam scores for the 11 statistics students, there are 11 data points. Therefore, there are 11 ε values. If you square each ε and add, you get

( ε 1 ) 2 + ( ε 2 ) 2 + ... + ( ε 11 ) 2 = Σ i = 1 11 ε 2

This is called the Sum of Squared Errors (SSE) .

Using calculus, you can determine the values of a and b that make the SSE a minimum. When you make the SSE a minimum, you have determined the points that are on the line of best fit. It turns out thatthe line of best fit has the equation:

y ^ = a + bx

where a = y ¯ - b x ¯ and b = Σ ( x - x ¯ ) ( y - y ¯ ) Σ ( x - x ¯ ) 2 .

x ¯ and y ¯ are the sample means of the x values and the y values, respectively. The best fit line always passes through the point ( x ¯ , y ¯ ) .

The slope b can be written as b = r ( s y s x ) where s y = the standard deviation of the y values and s x = the standard deviation of the x values. r is the correlation coefficient which is discussed in the next section.

Least squares criteria for best fit

The process of fitting the best fit line is called linear regression . The idea behind finding the best fit line is based on the assumption that the data are scattered about a straight line. The criteria for the best fit line is that the sum of the squared errors (SSE) is minimized, that is made as small as possible. Any other line you might choose would have a higher SSE than the best fit line. This best fit line is called the least squares regression line .

Computer spreadsheets, statistical software, and many calculators can quickly calculate the best fit line and create the graphs. The calculations tend to be tedious if done by hand. Instructions to use the TI-83, TI-83+, and TI-84+ calculators to find the best fit line and create a scatterplot are shown at the end of this section.

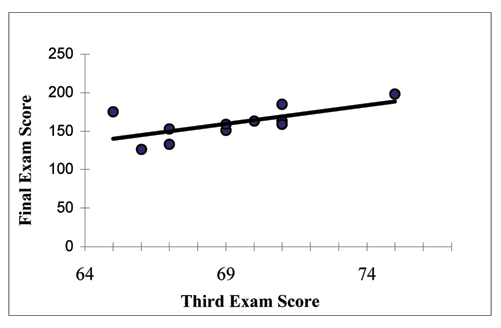
Third exam vs final exam example:

The graph of the line of best fit for the third exam/final exam example is shown below:

Scatterplot of the third exam scores by final exam scores and its line of best fit.

The least squares regression line (best fit line) for the third exam/final exam example has the equation:

y ^ = -173.51 + 4.83x
  • Remember, it is always important to plot a scatter diagram first. If the scatter plot indicates that there is a linear relationship betweenthe variables, then it is reasonable to use a best fit line to make predictions for y given x within the domain of x -values in the sample data, but not necessarily for x -values outside that domain.
  • You could use the line to predict the final exam score for a student who earned a grade of 73 on the third exam.
  • You should NOT use the line to predict the final exam score for a student who earned a grade of 50 on the third exam, because 50 is not within the domain of the x-values in the sample data, which are between 65 and 75.

Understanding slope

The slope of the line, b, describes how changes in the variables are related. It is important to interpret the slope of the line in the context of the situation represented by the data. You should be able to write a sentence interpreting the slope in plain English.

INTERPRETATION OF THE SLOPE: The slope of the best fit line tells us how the dependent variable (y) changes for every one unit increase in the independent (x) variable, on average.

    Third exam vs final exam example

  • Slope: The slope of the line is b = 4.83.
  • Interpretation: For a one point increase in the score on the third exam, the final exam score increases by 4.83 points, on average.

Using the ti-83+ and ti-84+ calculators

    Using the linear regression t test: linregttest

  1. In the STAT list editor, enter the X data in list L1 and the Y data in list L2, paired so that the corresponding (x,y) values are next to each other in the lists. (If a particular pair of values is repeated, enter it as many times as it appears in the data.)
  2. On the STAT TESTS menu, scroll down with the cursor to select the LinRegTTest. (Be careful to select LinRegTTest as some calculators may also have a different item called LinRegTInt.)
  3. On the LinRegTTest input screen enter: Xlist: L1 ; Ylist: L2 ; Freq: 1
  4. On the next line, at the prompt β or ρ, highlight "≠ 0" and press ENTER
  5. Leave the line for "RegEq:" blank
  6. Highlight Calculate and press ENTER.

1. Image of calculator input screen for LinRegTTest with input matching the instructions above. 2.Image of corresponding output calculator output screen for LinRegTTest: Output screen shows: Line 1. LinRegTTest; Line 2. y = a + bx; Line 3. beta does not equal 0 and rho does not equal 0; Line 4. t = 2.657560155; Line 5. df = 9; Line 6. a = 173.513363; Line 7. b = 4.827394209; Line 8. s = 16.41237711; Line 9. r squared = .4396931104; Line 10. r = .663093591

The output screen contains a lot of information. For now we will focus on a few items from the output, and will return later to the other items.

  • The second line says y=a+bx. Scroll down to find the values a=-173.513, and b=4.8273 ; the equation of the best fit line is y ^ = -173.51 + 4.83 x
  • The two items at the bottom are r 2 = .43969 and r =.663. For now, just note where to find these values; we will discuss them in the next two sections.

    Graphing the scatterplot and regression line

  1. We are assuming your X data is already entered in list L1 and your Y data is in list L2
  2. Press 2nd STATPLOT ENTER to use Plot 1
  3. On the input screen for PLOT 1, highlight On and press ENTER
  4. For TYPE: highlight the very first icon which is the scatterplot and press ENTER
  5. Indicate Xlist: L1 and Ylist: L2
  6. For Mark: it does not matter which symbol you highlight.
  7. Press the ZOOM key and then the number 9 (for menu item "ZoomStat") ; the calculator will fit the window to the data
  8. To graph the best fit line, press the "Y=" key and type the equation -173.5+4.83X into equation Y1. (The X key is immediately left of the STAT key). Press ZOOM 9 again to graph it.
  9. Optional: If you want to change the viewing window, press the WINDOW key. Enter your desired window using Xmin, Xmax, Ymin, Ymax

**With contributions from Roberta Bloom

Questions & Answers

what does preconceived mean
sammie Reply
physiological Psychology
Nwosu Reply
How can I develope my cognitive domain
Amanyire Reply
why is communication effective
Dakolo Reply
Communication is effective because it allows individuals to share ideas, thoughts, and information with others.
effective communication can lead to improved outcomes in various settings, including personal relationships, business environments, and educational settings. By communicating effectively, individuals can negotiate effectively, solve problems collaboratively, and work towards common goals.
it starts up serve and return practice/assessments.it helps find voice talking therapy also assessments through relaxed conversation.
miss
Every time someone flushes a toilet in the apartment building, the person begins to jumb back automatically after hearing the flush, before the water temperature changes. Identify the types of learning, if it is classical conditioning identify the NS, UCS, CS and CR. If it is operant conditioning, identify the type of consequence positive reinforcement, negative reinforcement or punishment
Wekolamo Reply
please i need answer
Wekolamo
because it helps many people around the world to understand how to interact with other people and understand them well, for example at work (job).
Manix Reply
Agreed 👍 There are many parts of our brains and behaviors, we really need to get to know. Blessings for everyone and happy Sunday!
ARC
A child is a member of community not society elucidate ?
JESSY Reply
Isn't practices worldwide, be it psychology, be it science. isn't much just a false belief of control over something the mind cannot truly comprehend?
Simon Reply
compare and contrast skinner's perspective on personality development on freud
namakula Reply
Skinner skipped the whole unconscious phenomenon and rather emphasized on classical conditioning
war
explain how nature and nurture affect the development and later the productivity of an individual.
Amesalu Reply
nature is an hereditary factor while nurture is an environmental factor which constitute an individual personality. so if an individual's parent has a deviant behavior and was also brought up in an deviant environment, observation of the behavior and the inborn trait we make the individual deviant.
Samuel
I am taking this course because I am hoping that I could somehow learn more about my chosen field of interest and due to the fact that being a PsyD really ignites my passion as an individual the more I hope to learn about developing and literally explore the complexity of my critical thinking skills
Zyryn Reply
good👍
Jonathan
and having a good philosophy of the world is like a sandwich and a peanut butter 👍
Jonathan
generally amnesi how long yrs memory loss
Kelu Reply
interpersonal relationships
Abdulfatai Reply
What would be the best educational aid(s) for gifted kids/savants?
Heidi Reply
treat them normal, if they want help then give them. that will make everyone happy
Saurabh
What are the treatment for autism?
Magret Reply
hello. autism is a umbrella term. autistic kids have different disorder overlapping. for example. a kid may show symptoms of ADHD and also learning disabilities. before treatment please make sure the kid doesn't have physical disabilities like hearing..vision..speech problem. sometimes these
Jharna
continue.. sometimes due to these physical problems..the diagnosis may be misdiagnosed. treatment for autism. well it depends on the severity. since autistic kids have problems in communicating and adopting to the environment.. it's best to expose the child in situations where the child
Jharna
child interact with other kids under doc supervision. play therapy. speech therapy. Engaging in different activities that activate most parts of the brain.. like drawing..painting. matching color board game. string and beads game. the more you interact with the child the more effective
Jharna
results you'll get.. please consult a therapist to know what suits best on your child. and last as a parent. I know sometimes it's overwhelming to guide a special kid. but trust the process and be strong and patient as a parent.
Jharna
Got questions? Join the online conversation and get instant answers!
Jobilize.com Reply

Get Jobilize Job Search Mobile App in your pocket Now!

Get it on Google Play Download on the App Store Now


Source:  OpenStax, Quantitative information analysis iii. OpenStax CNX. Dec 25, 2009 Download for free at http://cnx.org/content/col11155/1.1
Google Play and the Google Play logo are trademarks of Google Inc.

Notification Switch

Would you like to follow the 'Quantitative information analysis iii' conversation and receive update notifications?

Ask