<< Chapter < Page Chapter >> Page >
Simulink model for sampling and reconstruction using an impulse generator.

Before starting this experiment, use the MATLAB command close all to close all figures other than the Simulink windows. Double click on the icon named Sampling and Reconstruction Using An Impulse Generator to bring up the first experiment as shown in [link] . 
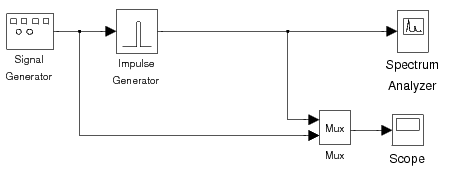
In this experiment, a sine wave is sampled at a frequencyof 1 Hz; then the sampled discrete-time signal is used to generaterectangular impulses of duration 0.3 sec and amplitude equal to the sample values.The block named Impulse Generator carries out both the sampling of the sine wave and its reconstruction with pulses. A single Scope is used to plot both the input and output of the impulse generator,and a Spectrum Analyzer is used to plot the output pulse train and its spectrum.

First, run the simulation with the frequency of input sine wave set to 0 . 1 Hz (initial setting of the experiment). Let the simulation run until it terminates to getan accurate plot of the output frequencies. Then print the output of Scope and the Spectrum Analyzer . Be sure to label your plots.

Submit the plot of the input/output signals and the plot of the output signal and its frequency spectrum.On the plot of the spectrum of the reconstructed signal, circle the aliases, i.e. thecomponents that do NOT correspond to the input sine wave.

Ideal impulse functions can only be approximated. In the initial setup, the pulse width is 0 . 3 sec, which is less then the sampling period of 1 sec.Try setting the pulse width to 0 . 1 sec and run the simulation. Print the output of the Spectrum Analyzer .

Submit the plot of the output frequency spectrum for a pulse width of 0 . 1 sec. Indicate on your plot what has changed and explain why .

Set the pulse width back to 0 . 3 sec and change the frequency of the sine wave to 0 . 8 Hz. Run the simulation and print the output of the Scope and the Spectrum Analyzer .

Submit the plot of the input/output signals and the plot of the output signal and its frequency spectrum.On the frequency plot, label the frequency peak that corresponds to the lowest frequency (the fundamental component) ofthe output signal. Explain why the lowest frequency is no longer the same as the frequency of the input sinusoid.

Leave the input frequency at 0 . 8 Hz. Now insert a filter right after the impulse generator.Use a 10th order Butterworth filter with acutoff frequency of 0 . 5 Hz. Connect the output of the filter to the Spectrum Analyzer and the Mux . Run the simulation, and print the output of Scope and the Spectrum Analyzer .

Submit the plot of the input/output signals and the plot of the output signal and its frequency spectrum.Explain why the output signal has the observed frequency spectrum.

Sampling and reconstruction with sample and hold

For help on printing figures in Simulink select the link.

Initial Simulink model for sampling and reconstruction using a sample-and-hold. This system only measures the frequencyresponse of the analog filters.

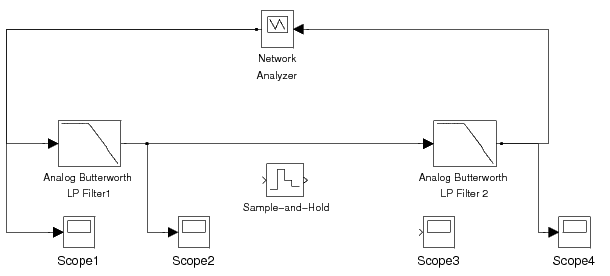
In this section, we will sample a continuous-time signal using a sample-and-hold and then reconstruct it.We already know that a sample-and-hold followed by a low-pass filter does not result in perfect reconstruction.This is because a sample-and-hold acts like a pulse generator with a pulse duration of onesampling period. This “pulse shape” of the sample-and-hold is whatdistorts the frequency spectrum (see Section "Sampling and Reconstruction Using a Sample-and-Hold" ).

Questions & Answers

what is biology
daniel Reply
what is diffusion
Emmanuel Reply
passive process of transport of low-molecular weight material according to its concentration gradient
AI-Robot
what is production?
Catherine
Pathogens and diseases
how did the oxygen help a human being
Achol Reply
how did the nutrition help the plants
Achol Reply
Biology is a branch of Natural science which deals/About living Organism.
Ahmedin Reply
what is phylogeny
Odigie Reply
evolutionary history and relationship of an organism or group of organisms
AI-Robot
ok
Deng
what is biology
Hajah Reply
cell is the smallest unit of the humanity biologically
Abraham
what is biology
Victoria Reply
what is biology
Abraham
HOW CAN MAN ORGAN FUNCTION
Alfred Reply
the diagram of the digestive system
Assiatu Reply
allimentary cannel
Ogenrwot
How does twins formed
William Reply
They formed in two ways first when one sperm and one egg are splited by mitosis or two sperm and two eggs join together
Oluwatobi
what is genetics
Josephine Reply
Genetics is the study of heredity
Misack
how does twins formed?
Misack
What is manual
Hassan Reply
discuss biological phenomenon and provide pieces of evidence to show that it was responsible for the formation of eukaryotic organelles
Joseph Reply
Got questions? Join the online conversation and get instant answers!
Jobilize.com Reply

Get Jobilize Job Search Mobile App in your pocket Now!

Get it on Google Play Download on the App Store Now


Source:  OpenStax, Purdue digital signal processing labs (ece 438). OpenStax CNX. Sep 14, 2009 Download for free at http://cnx.org/content/col10593/1.4
Google Play and the Google Play logo are trademarks of Google Inc.

Notification Switch

Would you like to follow the 'Purdue digital signal processing labs (ece 438)' conversation and receive update notifications?

Ask