To understand the structure of some regular right prisms
[LO 3.3, 3.4]
A.
Building containers
You will be given a sheet of shapes. You will need a ruler that you can measure with, a pair of scissors and glue or sticky tape. Colouring pens will also be helpful. Do the following with these shapes:
Carefully measure all the lines and write down your measurements ( you should be able to measure to the nearest half–millimetre). You must also do your best to measure the radius (or diameter) of the circle. If you have a protractor available, find out where the 90°–angles are.
Using these measurements, calculate the areas of the different shapes, and add the parts together to find out the total area of each of the four shapes. Set your work out very clearly so that anybody can understand what you have done. Use the proper names for the shapes you describe.
For example, for the last figure you could say:
Total area = small rectangle + small rectangle + large rectangle
= (
l ×
b ) + (
l ×
b ) + (
l ×
b )
and so on . . . (Remember to use appropriate units.)
Very carefully cut out the given shapes. You can colour these shapes to make it easier to see which the top and base are, and which the sides (the sides are striped). Now fold them and use tape, or glue and paper strips, to make four boxes. Keep the sides with the dotted lines on the outside.
Write down what the
Total Surface Area (TSA) of each shape is. (You have already calculated the answer!)
Work in groups of two or three to try to find out how many 1cm × 1cm blocks will fit into each box. This is called the
volume of the box. If you can find a method or a formula that will work with each of the four shapes, write that down carefully.
At the end of this exercise, you should have two formulas.
B.
Right prisms
Each of the four boxes is a
right prism . These are shapes with a top and base that are exactly the same size and shape, and sides that go up straight at right angles to the base. Look around to see whether you can discover shapes with these characteristics.
We name right prisms according to the shape of the base, e.g. square prism, rectangular prism, triangular prism and circular prism (cylinder).
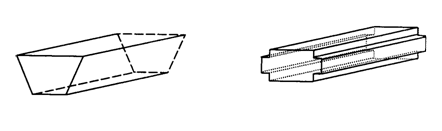
Are these two shapes right prisms? Describe the shape of the base of each, and confirm whether the sides go straight up at right angles to the base.
What kind of work did you do in this section? Score yourself in this table.
Did i work
Excellent
Adequately
Not well enough
well with my team?
according to instructions?
carefully?
accurately?
neatly?
C.
Formul a
s
To calculate the total surface area (TSA) and volume (V) of any right prism we use the following general formulas: (Please note that H refers to the prism height.)
TSA = 2 × base area + sides area and V = base area × prism height
Here are some important e
x amples. These are the cut–out prisms you made into boxes. Please note how each part of the calculation is done separately and then put into the formula at the end.
In economics, a perfect market refers to a theoretical construct where all participants have perfect information, goods are homogenous, there are no barriers to entry or exit, and prices are determined solely by supply and demand. It's an idealized model used for analysis,
When MP₁ becomes negative, TP start to decline.
Extuples Suppose that the short-run production function of certain cut-flower firm is given by: Q=4KL-0.6K2 - 0.112 •
Where is quantity of cut flower produced, I is labour input and K is fixed capital input (K-5). Determine the average product of lab
Kelo
Extuples Suppose that the short-run production function of certain cut-flower firm is given by: Q=4KL-0.6K2 - 0.112 •
Where is quantity of cut flower produced, I is labour input and K is fixed capital input (K-5). Determine the average product of labour (APL) and marginal product of labour (MPL)
Quantity demanded refers to the specific amount of a good or service that consumers are willing and able to purchase at a give price and within a specific time period. Demand, on the other hand, is a broader concept that encompasses the entire relationship between price and quantity demanded
Ezea
ok
Shukri
how do you save a country economic situation when it's falling apart
Economic growth as an increase in the production and consumption of goods and services within an economy.but
Economic development as a broader concept that encompasses not only economic growth but also social & human well being.
Shukri
production function means
Jabir
What do you think is more important to focus on when considering inequality ?
sir...I just want to ask one question... Define the term contract curve? if you are free please help me to find this answer 🙏
Asui
it is a curve that we get after connecting the pareto optimal combinations of two consumers after their mutually beneficial trade offs
Awais
thank you so much 👍 sir
Asui
In economics, the contract curve refers to the set of points in an Edgeworth box diagram where both parties involved in a trade cannot be made better off without making one of them worse off. It represents the Pareto efficient allocations of goods between two individuals or entities, where neither p
Cornelius
In economics, the contract curve refers to the set of points in an Edgeworth box diagram where both parties involved in a trade cannot be made better off without making one of them worse off. It represents the Pareto efficient allocations of goods between two individuals or entities,
Cornelius
Suppose a consumer consuming two commodities X and Y has
The following utility function u=X0.4 Y0.6. If the price of the X and Y are 2 and 3 respectively and income Constraint is birr 50.
A,Calculate quantities of x and y which maximize utility.
B,Calculate value of Lagrange multiplier.
C,Calculate quantities of X and Y consumed with a given price.
D,alculate optimum level of output .