

| << Chapter < Page | Chapter >> Page > |
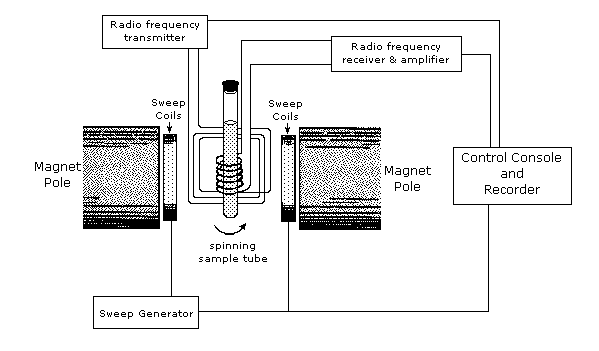
An example of an NMR spectrometer is given in [link] . NMR spectroscopy works by varying the machine’s emitted frequency over a small range while the sample is inside a constant magnetic field. Most of the magnets used in NMR machines to create the magnetic field range from 6 to 24 T. The sample is placed within the magnet and surrounded by superconducting coils, and is then subjected to a frequency from the radio wave source. A detector then interprets the results and sends it to the main console.
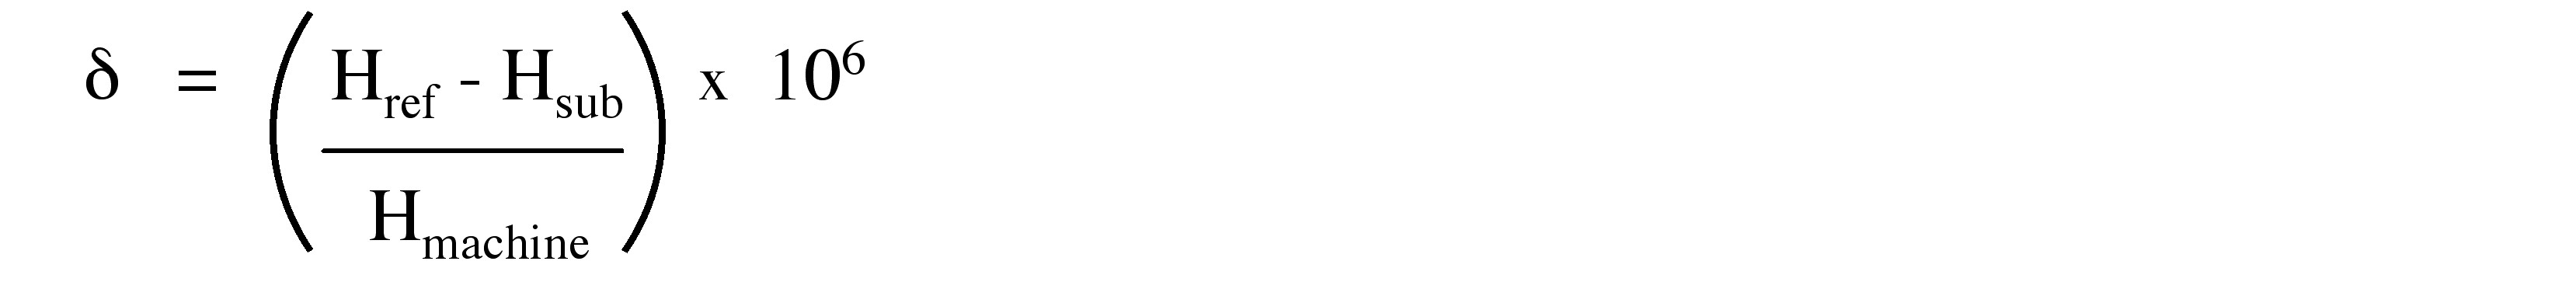
The different local chemical environments surrounding any particular nuclei causes them to resonate at slightly different frequencies. This is a result of a nucleus being more or less shielded than another. This is called the chemical shift (δ). One factor that affects chemical shift is the changing of electron density from around a nucleus, such as a bond to an electronegative group. Hydrogen bonding also changes the electron density in 1 H NMR, causing a larger shift. These frequency shifts are miniscule in comparison to the fundamental NMR frequency differences, on a scale of Hz as compared to MHz. For this reason chemical shifts (δ) are described by the unit ppm on an NMR spectra, [link] , where H ref = the resonance frequency of the reference, H sub = resonance frequency of the substance, and H machine = operating frequency of the spectometer.
Since the chemical shift (δ in ppm) is reported as a relative difference from some reference frequency, so a reference is required. In 1 H and 13 C NMR, for example, tetramethylsilane (TMS, Si(CH 3 ) 4 ) is used as the reference. Chemical shifts can be used to identify structural properties in a molecule based on our understanding of different chemical environments. Some examples of where different chemical environments fall on a 1 H NMR spectra are given in [link] .
| Functional group | Chemical shift range (ppm) |
| Alkyl (e.g., methyl -CH 3 ) | ~ 1 |
| Alkyl adjacent to oxygen (-CH 2 -O) | 3 - 4 |
| Alkene (=CH 2 ) | ~ 6 |
| Alkyne (C-H) | ~ 3 |
| Aromatic | 7 - 8 |
In [link] , an 1 H NMR spectra of ethanol, we can see a clear example of chemical shift. There are three sets of peaks that represent the six hydrogens of ethanol (C 2 H 6 O). The presence of three sets of peaks means that there are three different chemical environments that the hydrogens can be found in: the terminal methyl (CH 3 ) carbon’s three hydrogens, the two hydrogens on the methylene (CH 2 ) carbon adjacent to the oxygen, and the single hydrogen on the oxygen of the alcohol group (OH). Once we cover spin-spin coupling, we will have the tools available to match these groups of hydrogens to their respective peaks.

Another useful property that allows NMR spectra to give structural information is called spin-spin coupling, which is caused by spin coupling between NMR active nuclei that are not chemically identical. Different spin states interact through chemical bonds in a molecule to give rise to this coupling, which occurs when a nuclei being examined is disturbed or influenced by a nearby nuclear spin. In NMR spectra, this effect is shown through peak splitting that can give direct information concerning the connectivity of atoms in a molecule. Nuclei which share the same chemical shift do not form splitting peaks in an NMR spectra.
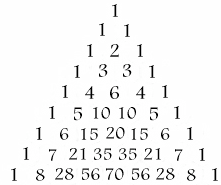
In general, neighboring NMR active nuclei three or fewer bonds away lead to this splitting. The splitting is described by the relationship where n neighboring nuclei result in n +1 peaks, and the area distribution can be seen in Pascal’s triangle in [link] . However, being adjacent to a strongly electronegative group such as oxygen can prevent spin-spin coupling. For example a doublet would have two peaks with intensity ratios of 1:1, while a quartet would have four peaks of relative intensities 1:3:3:1. The magnitude of the observed spin splitting depends on many factors and is given by the coupling constant J , which is in units of Hz.
Referring again to [link] , we have a good example of how spin-spin coupling manifests itself in an NMR spectra. In the spectra we have three sets of peaks: a quartet, triplet, and a singlet. If we start with the terminal carbon’s hydrogens in ethanol, using the n +1 rule we see that they have two hydrogens within three bonds (i.e., H-C-C-H), leading us to identify the triplet as the peaks for the terminal carbon’s hydrogens. Looking next at the two central hydrogens, they have four NMR active nuclei within three bonds (i.e., H-C-C-H), but there is no quintet on the spectra as might be expected. This can be explained by the fact that the single hydrogen bonded to the oxygen is shielded from spin-spin coupling, so it must be a singlet and the two central hydrogens form the quartet. We have now interpreted the NMR spectra of ethanol by identifying which nuclei correspond to each peak.
Mainly useful for proton NMR, the size of the peaks in the NMR spectra can give information concerning the number of nuclei that gave rise to that peak. This is done by measuring the peak’s area using integration. Yet even without using integration the size of different peaks can still give relative information about the number of nuclei. For example a singlet associated with three hydrogen atoms would be about 3 times larger than a singlet associated with a single hydrogen atom.
This can also be seen in the example in [link] . If we integrated the area under each peak, we would find that the ratios of the areas of the quartet, singlet, and triplet are approximately 2:1:3, respectively.
Despite all of its upsides, there are several limitations that can make NMR analysis difficult or impossible in certain situations. One such issue is that the desired isotope of an element that is needed for NMR analysis may have little or no natural abundance. For example the natural abundance of 13 C, the active isotope for carbon NMR, is about 11%, which works well for analysis. However, in the case of oxygen the active isotope for NMR is 17 O, which is only 0.035% naturally abundant. This means that there are certain elements that can essentially never be measured through NMR.
Another problem is that some elements have an extremely low magnetic moment, μ. The sensitivity of NMR machines is based on the magnetic moment of the specific element, but if the magnetic moment is too low it can be very difficult to obtain an NMR spectra with enough peak intensity to properly analyze.
Notification Switch
Would you like to follow the 'Basic knowledge of nuclear magnetic resonance spectroscopy ( nmr )' conversation and receive update notifications?

|
|

|
|

|
|

|
|
|
|
|

|
|

|
|

|
|

|
|
|
|