<< Chapter < Page Chapter >> Page >

Method

1. Cut a very thin slice (cross section) from the middle of the celery stem or the carrot root.

2. Place this section on a glass slide.

3. Cover the specimen with iodine solution in order to stain it. This makes it more visible under the microscope. The specimen can also be placed on a drop ofwater if iodine is not available.

4. Cover the specimen by carefully lowering the cover slip onto it with a dissecting needle or tweezers. Take care not to trap any air bubbles.

This link gives information about making a wet mount microscope slide and shows an instructional video.

http://www.microbehunter.com/2010/08/13/making-a-wet-mount-microscope-slide/

5. Call your teacher.

6. Switch on the microscope making sure the lowest objective is in position (the 4x objective).

7. Place your slide on the stage.

8. Focus the image under the 4x objective (lowest objective) and view the structure of the celery stem. Switch to the 10x objective to look a little moreclosely. To see amazing details of the structure of plant tissue, use the 40x objective and the slide, carefully observing all of the parts and differentcells.

9. Once you are able to see cells,

10. Call your teacher.

11. Make a biological drawing of your specimen as viewed under the microscope. Take note of the magnification and draw a scale bar. Label your diagramaccording to the tissues you have learnt about.

Variation: Be creative and try using your favourite vegetables! Which vegetables are roots, stems and leaves?

To prepare a slide:

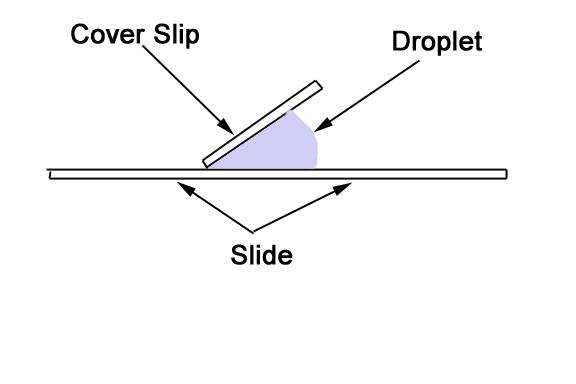
Place the sample in the centre of the slide. Add a drop of iodine or water on top of the sample. Place the cover slip next to the droplet as shown in thediagram.

Lower the coverslip into place with tweezers. As you lower the coverslip downwards, the drop will spread outward and suspend the sample between theslide and the coverslip.

(Diagrams from http://www.ehow.com/how_5164819_prepare-wet-mount-slide.html )

Investigation: water uptake by stem

Aim: To examine the uptake of water by the stem

Apparatus:

  • Water
  • Food colouring dye (available at supermarket)
  • White flower on a stem, e.g. Impatients, carnation or chrysanthemum
  • Scissors
  • Two jars, cups or measuring cylinders
  • Plastic tray
  • Sticky tape

Method:

Before starting this experiment, try to guess how the dye might move up the stem into the flower.

1. Fill one jar with plain water, and one with water containing several drops of food colouring dye.

2. Take the flower and carefully cut the stem lengthwise, either part way up the stem or right up to the base of the flower (try both – the results willbe different!)

3. Put one half of the stem into the jar containing plain water and one half of the stem into the jar containing food colouring dye. To make it easier to insert the stalks without breaking them, it helps to wedge paper underneath thejars so that you can tilt them towards each other. Tape the jars or cylinders down onto a tray so that they do not fall over.

4. Observe the flowers after a few hours and the next day, and note where the dye ends up in the flowerhead. You can leave the flowers up to a week but besure to make sure that they have enough water.

Questions & Answers

Examine the distinction between theory of comparative cost Advantage and theory of factor proportion
Fatima Reply
What is inflation
Bright Reply
a general and ongoing rise in the level of prices in an economy
AI-Robot
What are the factors that affect demand for a commodity
Florence Reply
price
Kenu
differentiate between demand and supply giving examples
Lambiv Reply
differentiated between demand and supply using examples
Lambiv
what is labour ?
Lambiv
how will I do?
Venny Reply
how is the graph works?I don't fully understand
Rezat Reply
information
Eliyee
devaluation
Eliyee
t
WARKISA
hi guys good evening to all
Lambiv
multiple choice question
Aster Reply
appreciation
Eliyee
explain perfect market
Lindiwe Reply
In economics, a perfect market refers to a theoretical construct where all participants have perfect information, goods are homogenous, there are no barriers to entry or exit, and prices are determined solely by supply and demand. It's an idealized model used for analysis,
Ezea
What is ceteris paribus?
Shukri Reply
other things being equal
AI-Robot
When MP₁ becomes negative, TP start to decline. Extuples Suppose that the short-run production function of certain cut-flower firm is given by: Q=4KL-0.6K2 - 0.112 • Where is quantity of cut flower produced, I is labour input and K is fixed capital input (K-5). Determine the average product of lab
Kelo
Extuples Suppose that the short-run production function of certain cut-flower firm is given by: Q=4KL-0.6K2 - 0.112 • Where is quantity of cut flower produced, I is labour input and K is fixed capital input (K-5). Determine the average product of labour (APL) and marginal product of labour (MPL)
Kelo
yes,thank you
Shukri
Can I ask you other question?
Shukri
what is monopoly mean?
Habtamu Reply
What is different between quantity demand and demand?
Shukri Reply
Quantity demanded refers to the specific amount of a good or service that consumers are willing and able to purchase at a give price and within a specific time period. Demand, on the other hand, is a broader concept that encompasses the entire relationship between price and quantity demanded
Ezea
ok
Shukri
how do you save a country economic situation when it's falling apart
Lilia Reply
what is the difference between economic growth and development
Fiker Reply
Economic growth as an increase in the production and consumption of goods and services within an economy.but Economic development as a broader concept that encompasses not only economic growth but also social & human well being.
Shukri
production function means
Jabir
What do you think is more important to focus on when considering inequality ?
Abdisa Reply
any question about economics?
Awais Reply
sir...I just want to ask one question... Define the term contract curve? if you are free please help me to find this answer 🙏
Asui
it is a curve that we get after connecting the pareto optimal combinations of two consumers after their mutually beneficial trade offs
Awais
thank you so much 👍 sir
Asui
In economics, the contract curve refers to the set of points in an Edgeworth box diagram where both parties involved in a trade cannot be made better off without making one of them worse off. It represents the Pareto efficient allocations of goods between two individuals or entities, where neither p
Cornelius
In economics, the contract curve refers to the set of points in an Edgeworth box diagram where both parties involved in a trade cannot be made better off without making one of them worse off. It represents the Pareto efficient allocations of goods between two individuals or entities,
Cornelius
Got questions? Join the online conversation and get instant answers!
Jobilize.com Reply

Get Jobilize Job Search Mobile App in your pocket Now!

Get it on Google Play Download on the App Store Now


Source:  OpenStax, Siyavula: life sciences grade 10. OpenStax CNX. Apr 11, 2012 Download for free at http://cnx.org/content/col11410/1.3
Google Play and the Google Play logo are trademarks of Google Inc.

Notification Switch

Would you like to follow the 'Siyavula: life sciences grade 10' conversation and receive update notifications?

Ask