<< Chapter < Page Chapter >> Page >

Apparatus:


Watch glass, bunsen burner, methanol, bamboo sticks, metal salts (e.g. NaCl , CuCl 2 , CaCl 2 , KCl , etc. ) and metal powders (e.g. copper, magnesium, zinc, iron, etc.)

Method:


For each salt or powder do the following:
  1. Dip a clean bamboo stick into the methanol
  2. Dip the stick into the salt or powder
  3. Wave the stick through the flame from the bunsen burner. DO NOT hold the stick in the flame, but rather wave it back and forth through the flame.
  4. Observe what happens

Results:


Record your results in a table, listing the metal salt and the colour of the flame.

Conclusion:


You should have observed different colours for each of the metal salts and powders that you tested.

The above experiment on flame tests relates to the line emission spectra of the metals. These line emission spectra are a direct result of the arrangement of the electrons in metals.

Energy diagrams and electrons

  1. Draw Aufbau diagrams to show the electron configuration of each of the following elements:
    1. magnesium
    2. potassium
    3. sulphur
    4. neon
    5. nitrogen
  2. Use the Aufbau diagrams you drew to help you complete the following table:
    Element No. of energy levels No. of core electrons No. of valence electrons Electron configuration (standard notation)
    Mg
    K
    S
    Ne
    N
  3. Rank the elements used above in order of increasing reactivity . Give reasons for the order you give.

Group work : building a model of an atom

Earlier in this chapter, we talked about different 'models' of the atom. In science, one of the uses of models is that they can help us to understand the structure of something that we can't see. In the case of the atom, models help us to build a picture in our heads of what the atom looks like.

Models are often simplified. The small toy cars that you may have played with as a child are models. They give you a good idea of what a real car looks like, but they are much smaller and much simpler. A model cannot always be absolutely accurate and it is important that we realise this so that we don't build up a false idea about something.

In groups of 4-5, you are going to build a model of an atom. Before you start, think about these questions:

  • What information do I know about the structure of the atom? (e.g. what parts make it up? how big is it?)
  • What materials can I use to represent these parts of the atom as accurately as I can?
  • How will I put all these different parts together in my model?

As a group, share your ideas and then plan how you will build your model. Once you have built your model, discuss the following questions:

  • Does our model give a good idea of what the atom actually looks like?
  • In what ways is our model inaccurate ? For example, we know that electrons move around the atom's nucleus, but in your model, it might not have been possible for you to show this.
  • Are there any ways in which our model could be improved?

Now look at what other groups have done. Discuss the same questions for each of the models you see and record your answers.

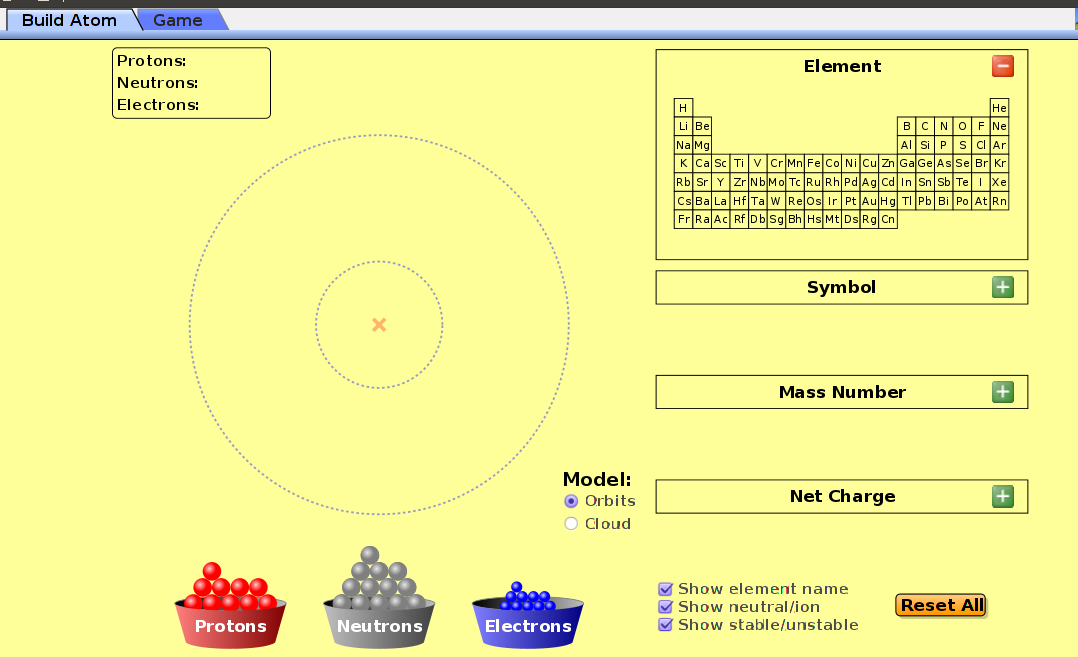
The following simulation allows you to build an atom
run demo

Build an atom simulation

Questions & Answers

What is inflation
Bright Reply
a general and ongoing rise in the level of prices in an economy
AI-Robot
What are the factors that affect demand for a commodity
Florence Reply
price
Kenu
differentiate between demand and supply giving examples
Lambiv Reply
differentiated between demand and supply using examples
Lambiv
what is labour ?
Lambiv
how will I do?
Venny Reply
how is the graph works?I don't fully understand
Rezat Reply
information
Eliyee
devaluation
Eliyee
t
WARKISA
hi guys good evening to all
Lambiv
multiple choice question
Aster Reply
appreciation
Eliyee
explain perfect market
Lindiwe Reply
In economics, a perfect market refers to a theoretical construct where all participants have perfect information, goods are homogenous, there are no barriers to entry or exit, and prices are determined solely by supply and demand. It's an idealized model used for analysis,
Ezea
What is ceteris paribus?
Shukri Reply
other things being equal
AI-Robot
When MP₁ becomes negative, TP start to decline. Extuples Suppose that the short-run production function of certain cut-flower firm is given by: Q=4KL-0.6K2 - 0.112 • Where is quantity of cut flower produced, I is labour input and K is fixed capital input (K-5). Determine the average product of lab
Kelo
Extuples Suppose that the short-run production function of certain cut-flower firm is given by: Q=4KL-0.6K2 - 0.112 • Where is quantity of cut flower produced, I is labour input and K is fixed capital input (K-5). Determine the average product of labour (APL) and marginal product of labour (MPL)
Kelo
yes,thank you
Shukri
Can I ask you other question?
Shukri
what is monopoly mean?
Habtamu Reply
What is different between quantity demand and demand?
Shukri Reply
Quantity demanded refers to the specific amount of a good or service that consumers are willing and able to purchase at a give price and within a specific time period. Demand, on the other hand, is a broader concept that encompasses the entire relationship between price and quantity demanded
Ezea
ok
Shukri
how do you save a country economic situation when it's falling apart
Lilia Reply
what is the difference between economic growth and development
Fiker Reply
Economic growth as an increase in the production and consumption of goods and services within an economy.but Economic development as a broader concept that encompasses not only economic growth but also social & human well being.
Shukri
production function means
Jabir
What do you think is more important to focus on when considering inequality ?
Abdisa Reply
any question about economics?
Awais Reply
sir...I just want to ask one question... Define the term contract curve? if you are free please help me to find this answer 🙏
Asui
it is a curve that we get after connecting the pareto optimal combinations of two consumers after their mutually beneficial trade offs
Awais
thank you so much 👍 sir
Asui
In economics, the contract curve refers to the set of points in an Edgeworth box diagram where both parties involved in a trade cannot be made better off without making one of them worse off. It represents the Pareto efficient allocations of goods between two individuals or entities, where neither p
Cornelius
In economics, the contract curve refers to the set of points in an Edgeworth box diagram where both parties involved in a trade cannot be made better off without making one of them worse off. It represents the Pareto efficient allocations of goods between two individuals or entities,
Cornelius
Suppose a consumer consuming two commodities X and Y has The following utility function u=X0.4 Y0.6. If the price of the X and Y are 2 and 3 respectively and income Constraint is birr 50. A,Calculate quantities of x and y which maximize utility. B,Calculate value of Lagrange multiplier. C,Calculate quantities of X and Y consumed with a given price. D,alculate optimum level of output .
Feyisa Reply
Answer
Feyisa
c
Jabir
Got questions? Join the online conversation and get instant answers!
Jobilize.com Reply

Get Jobilize Job Search Mobile App in your pocket Now!

Get it on Google Play Download on the App Store Now


Source:  OpenStax, Chemistry grade 10 [caps]. OpenStax CNX. Jun 13, 2011 Download for free at http://cnx.org/content/col11303/1.4
Google Play and the Google Play logo are trademarks of Google Inc.

Notification Switch

Would you like to follow the 'Chemistry grade 10 [caps]' conversation and receive update notifications?

Ask