<< Chapter < Page Chapter >> Page >

The born-haber cycle

It is not possible to measure lattice energies directly. However, the lattice energy can be calculated using the equation given in the previous section or by using a thermochemical cycle. The Born-Haber cycle    is an application of Hess’s law that breaks down the formation of an ionic solid into a series of individual steps:

  • Δ H f ° , the standard enthalpy of formation of the compound
  • IE , the ionization energy of the metal
  • EA , the electron affinity of the nonmetal
  • Δ H s ° , the enthalpy of sublimation of the metal
  • D , the bond dissociation energy of the nonmetal
  • Δ H lattice , the lattice energy of the compound

[link] diagrams the Born-Haber cycle for the formation of solid cesium fluoride.

A diagram is shown. An upward facing arrow is drawn to the far left of the chart and is labeled “H increasing.” A horizontal line is drawn at the bottom of the chart. A downward-facing, vertical arrow to the left side of this line is labeled, “Overall change.” Beside this arrow is another label, “capital delta H subscript f, equals negative 553.5 k J per mol, ( Enthalpy of formation ).” Three horizontal lines, one above the other, and all above the bottom line, are labeled, from bottom to top, as: “C s ( s ), plus sign, one half F subscript 2, ( g ),” “C s ( g ), plus sign, one half F subscript 2, ( g ),” and “C s, superscript positive sign, ( g ), plus sign, one half F subscript 2, ( g ).” Each of these lines is connected by an upward-facing vertical arrow. Each arrow is labeled, “capital delta H subscript 1, equals 76.5 k J per mol, ( Enthalpy of sublimation ),” “capital delta H subscript 2, equals 375.7 k J per mol, ( ionization energy ),” and “capital delta H subscript 3 equals 79.4 k J / mol ( one half dissociation energy ).” Another horizontal line is drawn in the center top portion of the diagram and is labeled “C s, superscript positive sign, ( g ), plus sign, F, ( g ).” There is one more horizontal line drawn to the right of the overall diagram and located halfway down the image. An arrow connects the top line to this line and is labeled, “capital delta H equals negative 328.2 k J / mol ( electron affinity ).” The line is labeled, “C s superscript positive sign ( g ) plus F superscript negative sign ( g ).” The arrow connecting this line to the bottom line is labeled, “negative capital delta H subscript lattice equals negative 756.9 k J / mol.” The arrow points to a label on the bottom line which reads, “C s F ( s ).”
The Born-Haber cycle shows the relative energies of each step involved in the formation of an ionic solid from the necessary elements in their reference states.

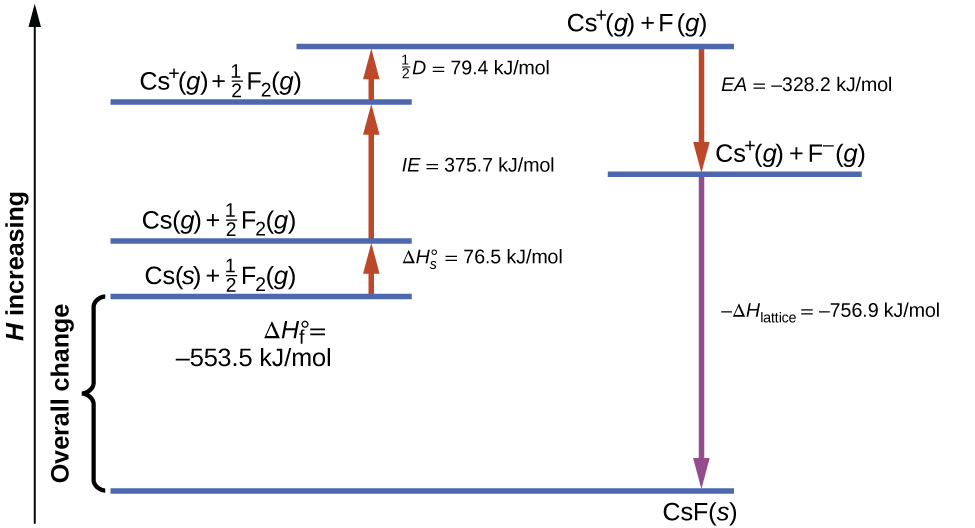
We begin with the elements in their most common states, Cs( s ) and F 2 ( g ). The Δ H s ° represents the conversion of solid cesium into a gas, and then the ionization energy converts the gaseous cesium atoms into cations. In the next step, we account for the energy required to break the F–F bond to produce fluorine atoms. Converting one mole of fluorine atoms into fluoride ions is an exothermic process, so this step gives off energy (the electron affinity) and is shown as decreasing along the y -axis. We now have one mole of Cs cations and one mole of F anions. These ions combine to produce solid cesium fluoride. The enthalpy change in this step is the negative of the lattice energy, so it is also an exothermic quantity. The total energy involved in this conversion is equal to the experimentally determined enthalpy of formation, Δ H f ° , of the compound from its elements. In this case, the overall change is exothermic.

Hess’s law can also be used to show the relationship between the enthalpies of the individual steps and the enthalpy of formation. [link] shows this for cesium chloride, CsCl 2 .

Enthalpy of sublimation of Cs( s ) Cs ( s ) Cs ( g ) Δ H = Δ H s ° = 76.5 kJ
One-half of the bond energy of Cl 2 1 2 Cl 2 ( g ) Cl ( g ) Δ H = 1 2 D = 122 kJ
Ionization energy of Na( g ) Na ( g ) Na + ( g ) + e Δ H = I E = 496 kJ
Negative of the electron affinity of Cl Cl ( g ) + e Cl ( g ) Δ H = E A = −368 kJ
Negative of the lattice energy of NaCl( s ) Na + ( g ) + Cl ( g ) NaCl ( s ) Δ H = −Δ H lattice = ?
Enthalpy of formation of NaCl( s ), add steps 1–5 Δ H = Δ H f ° = Δ H s ° + 1 2 D + I E + ( E A ) + ( Δ H lattice ) Na ( s ) + 1 2 Cl 2 ( g ) NaCl ( s ) = −411 kJ

Thus, the lattice energy can be calculated from other values. For cesium chloride, using this data, the lattice energy is:

Δ H lattice = ( 411 + 109 + 122 + 496 + 368 ) kJ = 770 kJ

The Born-Haber cycle may also be used to calculate any one of the other quantities in the equation for lattice energy, provided that the remainder is known. For example, if the relevant enthalpy of sublimation Δ H s ° , ionization energy (IE), bond dissociation enthalpy (D), lattice energy Δ H lattice, and standard enthalpy of formation Δ H f ° are known, the Born-Haber cycle can be used to determine the electron affinity of an atom.

Lattice energies calculated for ionic compounds are typically much higher than bond dissociation energies measured for covalent bonds. Whereas lattice energies typically fall in the range of 600–4000 kJ/mol (some even higher), covalent bond dissociation energies are typically between 150–400 kJ/mol for single bonds. Keep in mind, however, that these are not directly comparable values. For ionic compounds, lattice energies are associated with many interactions, as cations and anions pack together in an extended lattice. For covalent bonds, the bond dissociation energy is associated with the interaction of just two atoms.

Questions & Answers

differentiate between demand and supply giving examples
Lambiv Reply
differentiated between demand and supply using examples
Lambiv
what is labour ?
Lambiv
how will I do?
Venny Reply
how is the graph works?I don't fully understand
Rezat Reply
information
Eliyee
devaluation
Eliyee
t
WARKISA
hi guys good evening to all
Lambiv
multiple choice question
Aster Reply
appreciation
Eliyee
explain perfect market
Lindiwe Reply
In economics, a perfect market refers to a theoretical construct where all participants have perfect information, goods are homogenous, there are no barriers to entry or exit, and prices are determined solely by supply and demand. It's an idealized model used for analysis,
Ezea
What is ceteris paribus?
Shukri Reply
other things being equal
AI-Robot
When MP₁ becomes negative, TP start to decline. Extuples Suppose that the short-run production function of certain cut-flower firm is given by: Q=4KL-0.6K2 - 0.112 • Where is quantity of cut flower produced, I is labour input and K is fixed capital input (K-5). Determine the average product of lab
Kelo
Extuples Suppose that the short-run production function of certain cut-flower firm is given by: Q=4KL-0.6K2 - 0.112 • Where is quantity of cut flower produced, I is labour input and K is fixed capital input (K-5). Determine the average product of labour (APL) and marginal product of labour (MPL)
Kelo
yes,thank you
Shukri
Can I ask you other question?
Shukri
what is monopoly mean?
Habtamu Reply
What is different between quantity demand and demand?
Shukri Reply
Quantity demanded refers to the specific amount of a good or service that consumers are willing and able to purchase at a give price and within a specific time period. Demand, on the other hand, is a broader concept that encompasses the entire relationship between price and quantity demanded
Ezea
ok
Shukri
how do you save a country economic situation when it's falling apart
Lilia Reply
what is the difference between economic growth and development
Fiker Reply
Economic growth as an increase in the production and consumption of goods and services within an economy.but Economic development as a broader concept that encompasses not only economic growth but also social & human well being.
Shukri
production function means
Jabir
What do you think is more important to focus on when considering inequality ?
Abdisa Reply
any question about economics?
Awais Reply
sir...I just want to ask one question... Define the term contract curve? if you are free please help me to find this answer 🙏
Asui
it is a curve that we get after connecting the pareto optimal combinations of two consumers after their mutually beneficial trade offs
Awais
thank you so much 👍 sir
Asui
In economics, the contract curve refers to the set of points in an Edgeworth box diagram where both parties involved in a trade cannot be made better off without making one of them worse off. It represents the Pareto efficient allocations of goods between two individuals or entities, where neither p
Cornelius
In economics, the contract curve refers to the set of points in an Edgeworth box diagram where both parties involved in a trade cannot be made better off without making one of them worse off. It represents the Pareto efficient allocations of goods between two individuals or entities,
Cornelius
Suppose a consumer consuming two commodities X and Y has The following utility function u=X0.4 Y0.6. If the price of the X and Y are 2 and 3 respectively and income Constraint is birr 50. A,Calculate quantities of x and y which maximize utility. B,Calculate value of Lagrange multiplier. C,Calculate quantities of X and Y consumed with a given price. D,alculate optimum level of output .
Feyisa Reply
Answer
Feyisa
c
Jabir
the market for lemon has 10 potential consumers, each having an individual demand curve p=101-10Qi, where p is price in dollar's per cup and Qi is the number of cups demanded per week by the i th consumer.Find the market demand curve using algebra. Draw an individual demand curve and the market dema
Gsbwnw Reply
suppose the production function is given by ( L, K)=L¼K¾.assuming capital is fixed find APL and MPL. consider the following short run production function:Q=6L²-0.4L³ a) find the value of L that maximizes output b)find the value of L that maximizes marginal product
Abdureman
types of unemployment
Yomi Reply
What is the difference between perfect competition and monopolistic competition?
Mohammed
Got questions? Join the online conversation and get instant answers!
Jobilize.com Reply
Practice Key Terms 3

Get Jobilize Job Search Mobile App in your pocket Now!

Get it on Google Play Download on the App Store Now


Source:  OpenStax, Chemistry. OpenStax CNX. May 20, 2015 Download for free at http://legacy.cnx.org/content/col11760/1.9
Google Play and the Google Play logo are trademarks of Google Inc.

Notification Switch

Would you like to follow the 'Chemistry' conversation and receive update notifications?

Ask