<< Chapter < Page Chapter >> Page >

To learn more about atoms, isotopes, and how to tell one isotope from another, visit this site and run the simulation.

The periodic table

The different elements are organized and displayed in the periodic table    . Devised by Russian chemist Dmitri Mendeleev (1834–1907) in 1869, the table groups elements that, although unique, share certain chemical properties with other elements. The properties of elements are responsible for their physical state at room temperature: they may be gases, solids, or liquids. Elements also have specific chemical reactivity    , the ability to combine and to chemically bond with each other.

In the periodic table, shown in [link] , the elements are organized and displayed according to their atomic number and are arranged in a series of rows and columns based on shared chemical and physical properties. In addition to providing the atomic number for each element, the periodic table also displays the element’s atomic mass. Looking at carbon, for example, its symbol (C) and name appear, as well as its atomic number of six (in the upper left-hand corner) and its atomic mass of 12.11.

The periodic table consists of eighteen groups and seven periods. Two additional rows of elements, known as the lanthanides and actinides, are placed beneath the main table. The lanthanides include elements 57 through 71 and belong in period seven between groups three and four. The actinides include elements 89 through 98 and belong in period eight between the same groups. These elements are placed separately to make the table more compact. For each element, the name, atomic symbol, atomic number, and atomic mass are provided. The atomic number is a whole number that represents the number of protons. The atomic mass, which is the average mass of different isotopes, is estimated to two decimal places. For example, hydrogen has the atomic symbol H, the atomic number 1, and an atomic mass of 1.01. The atomic mass is always larger that the atomic number. For most small elements, the atomic mass is approximately double the atomic number as the number of protons and neutrons is about equal. The elements are divided into three categories: metals, nonmetals and metalloids. These form a diagonal line from period two, group thirteen to period seven, group sixteen. All elements to the left of the metalloids are metals, and all elements to the right are nonmetals.
The periodic table shows the atomic mass and atomic number of each element. The atomic number appears above the symbol for the element and the approximate atomic mass appears below it.

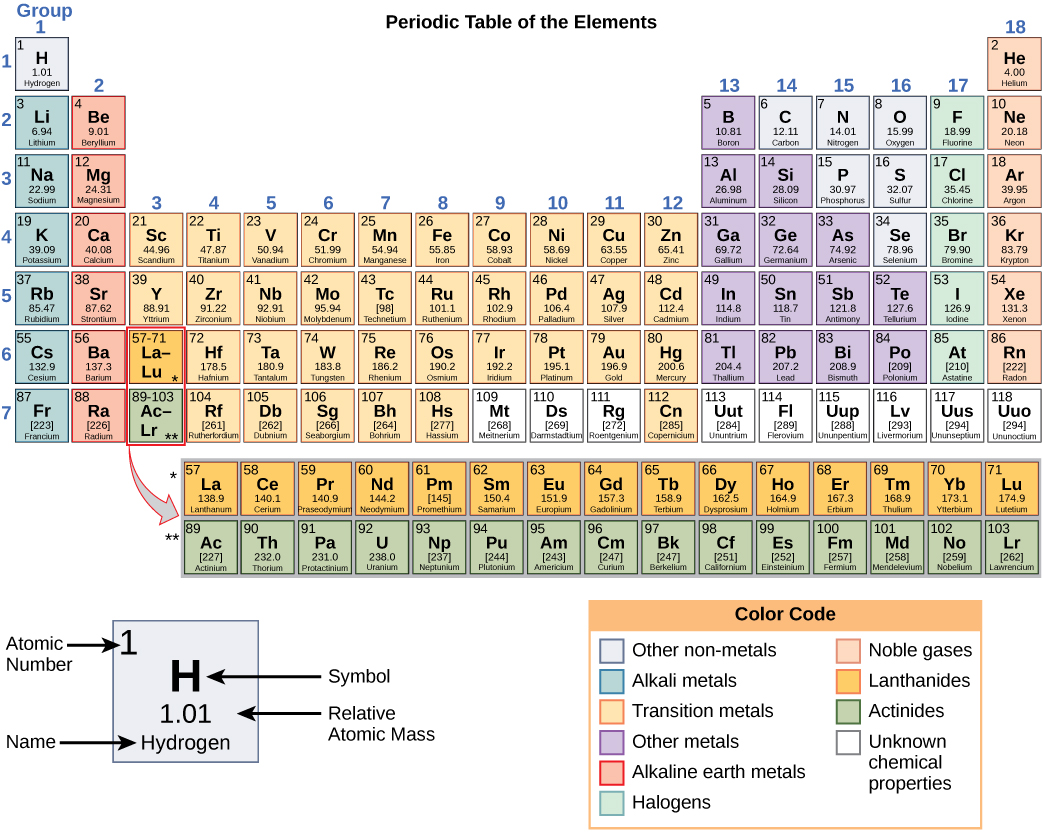
The periodic table groups elements according to chemical properties. The differences in chemical reactivity between the elements are based on the number and spatial distribution of an atom’s electrons. Atoms that chemically react and bond to each other form molecules. Molecules are simply two or more atoms chemically bonded together. Logically, when two atoms chemically bond to form a molecule, their electrons, which form the outermost region of each atom, come together first as the atoms form a chemical bond.

Electron shells and the bohr model

It should be stressed that there is a connection between the number of protons in an element, the atomic number that distinguishes one element from another, and the number of electrons it has. In all electrically neutral atoms, the number of electrons is the same as the number of protons. Thus, each element, at least when electrically neutral, has a characteristic number of electrons equal to its atomic number.

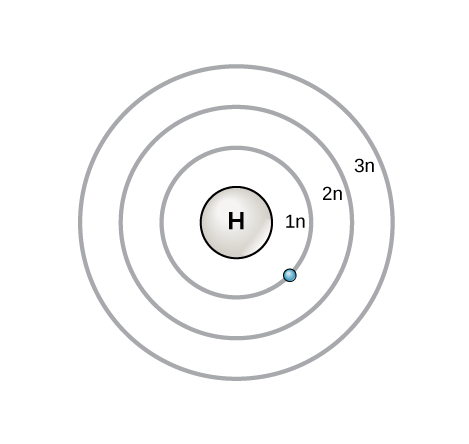
An early model of the atom was developed in 1913 by Danish scientist Niels Bohr (1885–1962). The Bohr model shows the atom as a central nucleus containing protons and neutrons, with the electrons in circular orbitals at specific distances from the nucleus, as illustrated in [link] . These orbits form electron shells or energy levels, which are a way of visualizing the number of electrons in the outermost shells. These energy levels are designated by a number and the symbol “n.” For example, 1n represents the first energy level located closest to the nucleus.

Three concentric circles around the nucleus of a hydrogen atom represent principal shells. These are named 1n, 2n, and 3n in order of increasing distance from the nucleus. An electron orbits in the shell closest to the nucleus, 1n.
The Bohr model was developed by Niels Bohrs in 1913. In this model, electrons exist within principal shells. An electron normally exists in the lowest energy shell available, which is the one closest to the nucleus. Energy from a photon of light can bump it up to a higher energy shell, but this situation is unstable, and the electron quickly decays back to the ground state. In the process, a photon of light is released.

Questions & Answers

What are the factors that affect demand for a commodity
Florence Reply
differentiate between demand and supply giving examples
Lambiv Reply
differentiated between demand and supply using examples
Lambiv
what is labour ?
Lambiv
how will I do?
Venny Reply
how is the graph works?I don't fully understand
Rezat Reply
information
Eliyee
devaluation
Eliyee
t
WARKISA
hi guys good evening to all
Lambiv
multiple choice question
Aster Reply
appreciation
Eliyee
explain perfect market
Lindiwe Reply
In economics, a perfect market refers to a theoretical construct where all participants have perfect information, goods are homogenous, there are no barriers to entry or exit, and prices are determined solely by supply and demand. It's an idealized model used for analysis,
Ezea
What is ceteris paribus?
Shukri Reply
other things being equal
AI-Robot
When MP₁ becomes negative, TP start to decline. Extuples Suppose that the short-run production function of certain cut-flower firm is given by: Q=4KL-0.6K2 - 0.112 • Where is quantity of cut flower produced, I is labour input and K is fixed capital input (K-5). Determine the average product of lab
Kelo
Extuples Suppose that the short-run production function of certain cut-flower firm is given by: Q=4KL-0.6K2 - 0.112 • Where is quantity of cut flower produced, I is labour input and K is fixed capital input (K-5). Determine the average product of labour (APL) and marginal product of labour (MPL)
Kelo
yes,thank you
Shukri
Can I ask you other question?
Shukri
what is monopoly mean?
Habtamu Reply
What is different between quantity demand and demand?
Shukri Reply
Quantity demanded refers to the specific amount of a good or service that consumers are willing and able to purchase at a give price and within a specific time period. Demand, on the other hand, is a broader concept that encompasses the entire relationship between price and quantity demanded
Ezea
ok
Shukri
how do you save a country economic situation when it's falling apart
Lilia Reply
what is the difference between economic growth and development
Fiker Reply
Economic growth as an increase in the production and consumption of goods and services within an economy.but Economic development as a broader concept that encompasses not only economic growth but also social & human well being.
Shukri
production function means
Jabir
What do you think is more important to focus on when considering inequality ?
Abdisa Reply
any question about economics?
Awais Reply
sir...I just want to ask one question... Define the term contract curve? if you are free please help me to find this answer 🙏
Asui
it is a curve that we get after connecting the pareto optimal combinations of two consumers after their mutually beneficial trade offs
Awais
thank you so much 👍 sir
Asui
In economics, the contract curve refers to the set of points in an Edgeworth box diagram where both parties involved in a trade cannot be made better off without making one of them worse off. It represents the Pareto efficient allocations of goods between two individuals or entities, where neither p
Cornelius
In economics, the contract curve refers to the set of points in an Edgeworth box diagram where both parties involved in a trade cannot be made better off without making one of them worse off. It represents the Pareto efficient allocations of goods between two individuals or entities,
Cornelius
Suppose a consumer consuming two commodities X and Y has The following utility function u=X0.4 Y0.6. If the price of the X and Y are 2 and 3 respectively and income Constraint is birr 50. A,Calculate quantities of x and y which maximize utility. B,Calculate value of Lagrange multiplier. C,Calculate quantities of X and Y consumed with a given price. D,alculate optimum level of output .
Feyisa Reply
Answer
Feyisa
c
Jabir
the market for lemon has 10 potential consumers, each having an individual demand curve p=101-10Qi, where p is price in dollar's per cup and Qi is the number of cups demanded per week by the i th consumer.Find the market demand curve using algebra. Draw an individual demand curve and the market dema
Gsbwnw Reply
suppose the production function is given by ( L, K)=L¼K¾.assuming capital is fixed find APL and MPL. consider the following short run production function:Q=6L²-0.4L³ a) find the value of L that maximizes output b)find the value of L that maximizes marginal product
Abdureman
Got questions? Join the online conversation and get instant answers!
Jobilize.com Reply

Get Jobilize Job Search Mobile App in your pocket Now!

Get it on Google Play Download on the App Store Now


Source:  OpenStax, Biology. OpenStax CNX. Feb 29, 2016 Download for free at http://cnx.org/content/col11448/1.10
Google Play and the Google Play logo are trademarks of Google Inc.

Notification Switch

Would you like to follow the 'Biology' conversation and receive update notifications?

Ask