<< Chapter < Page Chapter >> Page >

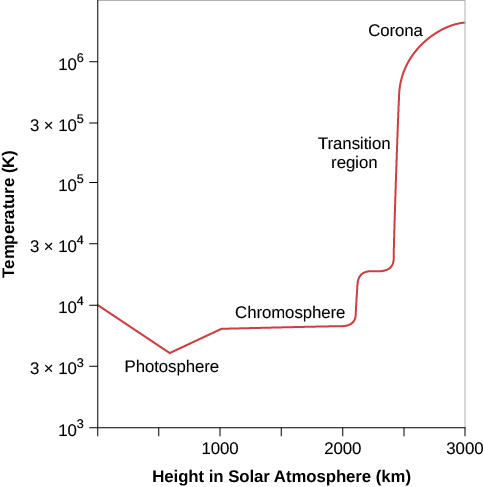
The temperature of the chromosphere is about 10,000 K. This means that the chromosphere is hotter than the photosphere, which should seem surprising. In all the situations we are familiar with, temperatures fall as one moves away from the source of heat, and the chromosphere is farther from the center of the Sun than the photosphere is.

The transition region

The increase in temperature does not stop with the chromosphere. Above it is a region in the solar atmosphere where the temperature changes from 10,000 K (typical of the chromosphere) to nearly a million degrees. The hottest part of the solar atmosphere, which has a temperature of a million degrees or more, is called the corona    . Appropriately, the part of the Sun where the rapid temperature rise occurs is called the transition region    . It is probably only a few tens of kilometers thick. [link] summarizes how the temperature of the solar atmosphere changes from the photosphere outward.

Temperatures in the solar atmosphere.

A graph of temperatures in the solar atmosphere. The x-axis is labeled “Height in Solar Atmosphere (km” and ranges from 0 to 3000. The y-axis is labeled “Temperature (K)” and ranges from 10 to the third to 10 to the sixth. A line starts at 0 km and 10 to the forth K, drops to 500 km and approximately 3 times 10 to the third K (labeled Photosphere), increases to approximately 1000 km and 6 times 10 to the third K, stays at that temperature to 2000 km (labeled Chromosphere), then rises from 2000 km onward. Transition region is labeled at around 1.5 times 10 to the fifth, and Corona is labeled above 10 to the sixth.
On this graph, temperature is shown increasing upward, and height above the photosphere is shown increasing to the right. Note the very rapid increase in temperature over a very short distance in the transition region between the chromosphere and the corona.

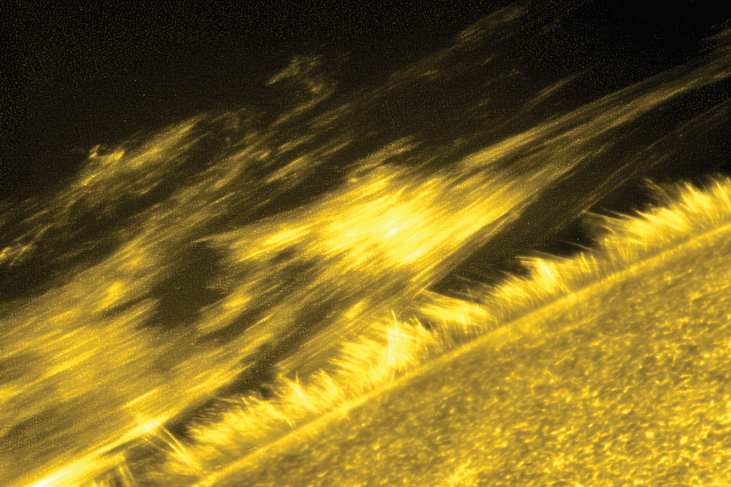
In 2013, NASA launched the Interface Region Imaging Spectrograph (IRIS) to study the transition region to understand better how and why this sharp temperature increase occurs. IRIS is the first space mission that is able to obtain high spatial resolution images of the different features produced over this wide temperature range and to see how they change with time and location ( [link] ).

Portion of the transition region.

An image of a portion of the transition region of the corona, showing a filament, or ribbon-like structure made up of many individual threads.
This image shows a giant ribbon of relatively cool gas threading through the lower portion of the hot corona. This ribbon (the technical term is filament) is made up of many individual threads. Time-lapse movies of this filament showed that it gradually heated as it moved through the corona. Scientists study events like this in order to try to understand what heats the chromosphere and corona to high temperatures. The “whiskers” at the edge of the Sun are spicules, jets of gas that shoot material up from the Sun’s surface and disappear after only a few minutes. This single image gives a hint of just how complicated it is to construct a model of the all the different structures and heating mechanisms in the solar atmosphere. (credit: JAXA/NASA/Hinode)

[link] and the red graph in [link] make the Sun seem rather like an onion, with smooth spherical shells, each one with a different temperature. For a long time, astronomers did indeed think of the Sun this way. However, we now know that while this idea of layers—photosphere, chromosphere, transition region, corona—describes the big picture fairly well, the Sun’s atmosphere is really more complicated, with hot and cool regions intermixed. For example, clouds of carbon monoxide gas with temperatures colder than 4000 K have now been found at the same height above the photosphere as the much hotter gas of the chromosphere.

Questions & Answers

Examine the distinction between theory of comparative cost Advantage and theory of factor proportion
Fatima Reply
What is inflation
Bright Reply
a general and ongoing rise in the level of prices in an economy
AI-Robot
What are the factors that affect demand for a commodity
Florence Reply
price
Kenu
differentiate between demand and supply giving examples
Lambiv Reply
differentiated between demand and supply using examples
Lambiv
what is labour ?
Lambiv
how will I do?
Venny Reply
how is the graph works?I don't fully understand
Rezat Reply
information
Eliyee
devaluation
Eliyee
t
WARKISA
hi guys good evening to all
Lambiv
multiple choice question
Aster Reply
appreciation
Eliyee
explain perfect market
Lindiwe Reply
In economics, a perfect market refers to a theoretical construct where all participants have perfect information, goods are homogenous, there are no barriers to entry or exit, and prices are determined solely by supply and demand. It's an idealized model used for analysis,
Ezea
What is ceteris paribus?
Shukri Reply
other things being equal
AI-Robot
When MP₁ becomes negative, TP start to decline. Extuples Suppose that the short-run production function of certain cut-flower firm is given by: Q=4KL-0.6K2 - 0.112 • Where is quantity of cut flower produced, I is labour input and K is fixed capital input (K-5). Determine the average product of lab
Kelo
Extuples Suppose that the short-run production function of certain cut-flower firm is given by: Q=4KL-0.6K2 - 0.112 • Where is quantity of cut flower produced, I is labour input and K is fixed capital input (K-5). Determine the average product of labour (APL) and marginal product of labour (MPL)
Kelo
yes,thank you
Shukri
Can I ask you other question?
Shukri
what is monopoly mean?
Habtamu Reply
What is different between quantity demand and demand?
Shukri Reply
Quantity demanded refers to the specific amount of a good or service that consumers are willing and able to purchase at a give price and within a specific time period. Demand, on the other hand, is a broader concept that encompasses the entire relationship between price and quantity demanded
Ezea
ok
Shukri
how do you save a country economic situation when it's falling apart
Lilia Reply
what is the difference between economic growth and development
Fiker Reply
Economic growth as an increase in the production and consumption of goods and services within an economy.but Economic development as a broader concept that encompasses not only economic growth but also social & human well being.
Shukri
production function means
Jabir
What do you think is more important to focus on when considering inequality ?
Abdisa Reply
any question about economics?
Awais Reply
sir...I just want to ask one question... Define the term contract curve? if you are free please help me to find this answer 🙏
Asui
it is a curve that we get after connecting the pareto optimal combinations of two consumers after their mutually beneficial trade offs
Awais
thank you so much 👍 sir
Asui
In economics, the contract curve refers to the set of points in an Edgeworth box diagram where both parties involved in a trade cannot be made better off without making one of them worse off. It represents the Pareto efficient allocations of goods between two individuals or entities, where neither p
Cornelius
In economics, the contract curve refers to the set of points in an Edgeworth box diagram where both parties involved in a trade cannot be made better off without making one of them worse off. It represents the Pareto efficient allocations of goods between two individuals or entities,
Cornelius
Got questions? Join the online conversation and get instant answers!
Jobilize.com Reply
Practice Key Terms 9

Get Jobilize Job Search Mobile App in your pocket Now!

Get it on Google Play Download on the App Store Now


Source:  OpenStax, Astronomy. OpenStax CNX. Apr 12, 2017 Download for free at http://cnx.org/content/col11992/1.13
Google Play and the Google Play logo are trademarks of Google Inc.

Notification Switch

Would you like to follow the 'Astronomy' conversation and receive update notifications?

Ask