<< Chapter < Page Chapter >> Page >

Learning objectives

By the end of this section, you will be able to:

  • Trace the rise and fall of quasars over cosmic time
  • Describe some of the ways in which galaxies and black holes influence each other’s growth
  • Describe some ways the first black holes may have formed
  • Explain why some black holes are not producing quasar emission but rather are quiescent

The quasars’ brilliance and large distance make them ideal probes of the far reaches of the universe and its remote past. Recall that when first introducing quasars, we mentioned that they generally tend to be far away. When we see extremely distant objects, we are seeing them as they were long ago. Radiation from a quasar 8 billion light-years away is telling us what that quasar and its environment were like 8 billion years ago, much closer to the time that the galaxy that surrounds it first formed. Astronomers have now detected light emitted from quasars that were already formed only a few hundred million years after the universe began its expansion 13.8 billion years ago. Thus, they give us a remarkable opportunity to learn about the time when large structures were first assembling in the cosmos.

The evolution of quasars

Quasars provide compelling evidence that we live in an evolving universe—one that changes with time. They tell us that astronomers living billions of years ago would have seen a universe that is very different from the universe of today. Counts of the number of quasars at different redshifts (and thus at different times in the evolution of the universe) show us how dramatic these changes are ( [link] ). We now know that the number of quasars was greatest at the time when the universe was only 20% of its present age.

Relative number of quasars and rate at which stars formed as a function of the age of the universe.

Relative Number of Quasars and Rate at Which Stars Formed as a Function of the Age of the Universe. In the plot at left, the vertical axis is labeled: “Relative Number of Quasars (MSun/yr/Mly3 x 10-3)”, ranging from 1 at bottom to 104 at top, in increments of 10n+1. The horizontal axis is labeled: “Time (billions of years)”, ranging from zero (“Big Bang”) at left to 13.8 (“Now”) at right. Data is plotted as red dots. The plot begins at 102 at T ~ 1 billion years, rises to 104 at about 2 billion years and trails off to about 5 at 10 billion years. In the plot at right, the vertical axis is labeled: “Star Formation Rate”, ranging from zero at bottom to 30 at top, in increments of 10. The horizontal axis is labeled: “Time (billions of years)”, ranging from zero (“Big Bang”) at left to 13.8 (“Now”) at right. Data is plotted as red dots, with a red dashed line fitting the data points. The curve is similar to the plot at left, the curve peaks near 28 at about 2 billion years.
An age of 0 on the plots corresponds to the beginning of the universe; an age of 13.8 corresponds to the present time. Both the number of quasars and the rate of star formation were at a peak when the universe was about 20% as old as it is now.

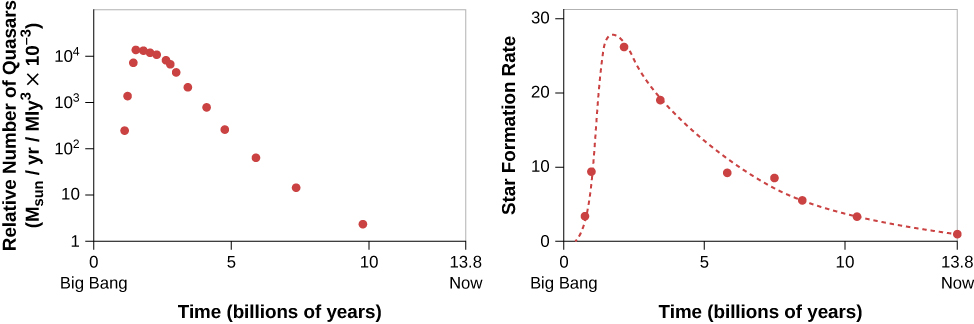
As you can see, the drop-off in the numbers of quasars as time gets nearer to the present day is quite abrupt. Observations also show that the emission from the accretion disks around the most massive black holes peaks early and then fades. The most powerful quasars are seen only at early times. In order to explain this result, we make use of our model of the energy source of the quasars—namely that quasars are black holes with enough fuel to make a brilliant accretion disk    right around them.

The fact that there were more quasars long ago (far away) than there are today (nearby) could be explained if there was more material available to be accreted by black holes early in the history of the universe. You might say that the quasars were more active when their black holes had fuel for their “energy-producing engines.” If that fuel was mostly consumed in the first few billion years after the universe began its expansion, then later in its life, a “hungry” black hole would have very little left with which to light up the galaxy’s central regions.

Questions & Answers

What is inflation
Bright Reply
a general and ongoing rise in the level of prices in an economy
AI-Robot
What are the factors that affect demand for a commodity
Florence Reply
price
Kenu
differentiate between demand and supply giving examples
Lambiv Reply
differentiated between demand and supply using examples
Lambiv
what is labour ?
Lambiv
how will I do?
Venny Reply
how is the graph works?I don't fully understand
Rezat Reply
information
Eliyee
devaluation
Eliyee
t
WARKISA
hi guys good evening to all
Lambiv
multiple choice question
Aster Reply
appreciation
Eliyee
explain perfect market
Lindiwe Reply
In economics, a perfect market refers to a theoretical construct where all participants have perfect information, goods are homogenous, there are no barriers to entry or exit, and prices are determined solely by supply and demand. It's an idealized model used for analysis,
Ezea
What is ceteris paribus?
Shukri Reply
other things being equal
AI-Robot
When MP₁ becomes negative, TP start to decline. Extuples Suppose that the short-run production function of certain cut-flower firm is given by: Q=4KL-0.6K2 - 0.112 • Where is quantity of cut flower produced, I is labour input and K is fixed capital input (K-5). Determine the average product of lab
Kelo
Extuples Suppose that the short-run production function of certain cut-flower firm is given by: Q=4KL-0.6K2 - 0.112 • Where is quantity of cut flower produced, I is labour input and K is fixed capital input (K-5). Determine the average product of labour (APL) and marginal product of labour (MPL)
Kelo
yes,thank you
Shukri
Can I ask you other question?
Shukri
what is monopoly mean?
Habtamu Reply
What is different between quantity demand and demand?
Shukri Reply
Quantity demanded refers to the specific amount of a good or service that consumers are willing and able to purchase at a give price and within a specific time period. Demand, on the other hand, is a broader concept that encompasses the entire relationship between price and quantity demanded
Ezea
ok
Shukri
how do you save a country economic situation when it's falling apart
Lilia Reply
what is the difference between economic growth and development
Fiker Reply
Economic growth as an increase in the production and consumption of goods and services within an economy.but Economic development as a broader concept that encompasses not only economic growth but also social & human well being.
Shukri
production function means
Jabir
What do you think is more important to focus on when considering inequality ?
Abdisa Reply
any question about economics?
Awais Reply
sir...I just want to ask one question... Define the term contract curve? if you are free please help me to find this answer 🙏
Asui
it is a curve that we get after connecting the pareto optimal combinations of two consumers after their mutually beneficial trade offs
Awais
thank you so much 👍 sir
Asui
In economics, the contract curve refers to the set of points in an Edgeworth box diagram where both parties involved in a trade cannot be made better off without making one of them worse off. It represents the Pareto efficient allocations of goods between two individuals or entities, where neither p
Cornelius
In economics, the contract curve refers to the set of points in an Edgeworth box diagram where both parties involved in a trade cannot be made better off without making one of them worse off. It represents the Pareto efficient allocations of goods between two individuals or entities,
Cornelius
Suppose a consumer consuming two commodities X and Y has The following utility function u=X0.4 Y0.6. If the price of the X and Y are 2 and 3 respectively and income Constraint is birr 50. A,Calculate quantities of x and y which maximize utility. B,Calculate value of Lagrange multiplier. C,Calculate quantities of X and Y consumed with a given price. D,alculate optimum level of output .
Feyisa Reply
Answer
Feyisa
c
Jabir
Got questions? Join the online conversation and get instant answers!
Jobilize.com Reply

Get Jobilize Job Search Mobile App in your pocket Now!

Get it on Google Play Download on the App Store Now


Source:  OpenStax, Astronomy. OpenStax CNX. Apr 12, 2017 Download for free at http://cnx.org/content/col11992/1.13
Google Play and the Google Play logo are trademarks of Google Inc.

Notification Switch

Would you like to follow the 'Astronomy' conversation and receive update notifications?

Ask