Explain how galaxies grow by merging with other galaxies and by consuming smaller galaxies (for lunch)
Describe the effects that supermassive black holes in the centers of most galaxies have on the fate of their host galaxies
One of the conclusions astronomers have reached from studying distant galaxies is that collisions and mergers of whole galaxies play a crucial role in determining how galaxies acquired the shapes and sizes we see today. Only a few of the nearby galaxies are currently involved in collisions, but detailed studies of those tell us what to look for when we seek evidence of mergers in very distant and very faint galaxies. These in turn give us important clues about the different evolutionary paths galaxies have taken over cosmic time. Let’s examine in more detail what happens when two galaxies collide.
Mergers and cannibalism
[link] shows a dynamic view of two galaxies that are colliding. The stars themselves in this pair of galaxies will not be affected much by this cataclysmic event. (See the Astronomy Basics feature box
Why Galaxies Collide but Stars Rarely Do .) Since there is a lot of space between the stars, a direct collision between two stars is very unlikely. However, the
orbits of many of the stars will be changed as the two galaxies move through each other, and the change in orbits can totally alter the appearance of the interacting galaxies. A gallery of interesting colliding galaxies is shown in
[link] . Great rings, huge tendrils of stars and gas, and other complex structures can form in such cosmic collisions. Indeed, these strange shapes are the signposts that astronomers use to identify colliding galaxies.
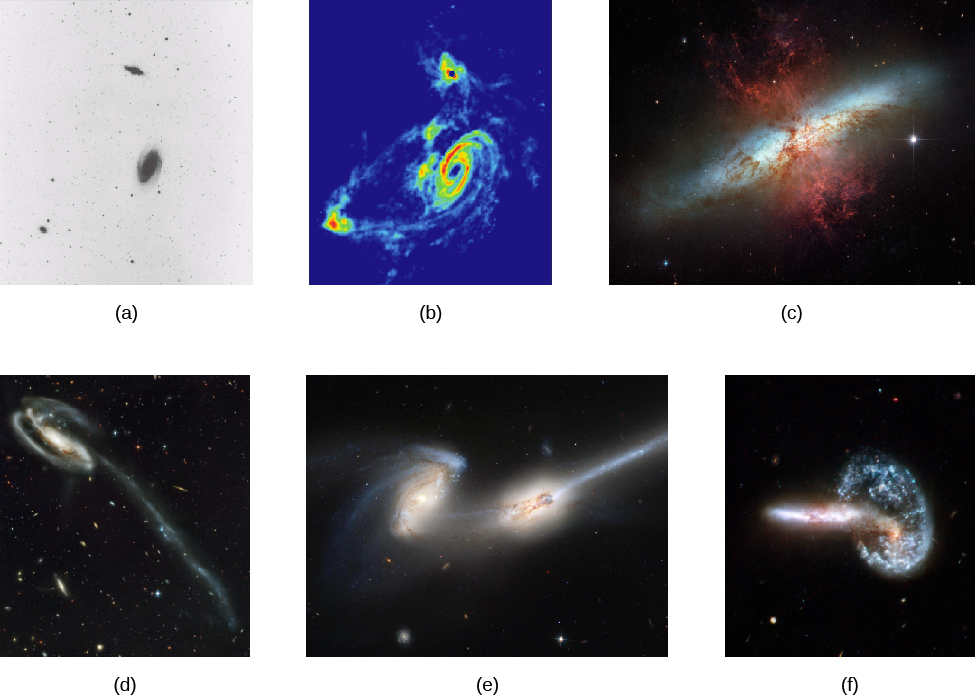
Gallery of interacting galaxies.
(a and b) M82 (smaller galaxy at top) and M83 (spiral) are seen (a) in a black-and-white visible light image and (b) in radio waves given off by cold hydrogen gas. The hydrogen image shows that the two galaxies are wrapped in a common shroud of gas that is being tugged and stretched by the gravity of the two galaxies. (c) This close-up view by the Hubble Space Telescope shows some of the effects of this interaction on galaxy M82, including gas streaming outward (red tendrils) powered by supernovae explosions of massive stars formed in the burst of star formation that was a result of the collision. (d) Galaxy UGC 10214 (“The Tadpole”) is a barred spiral galaxy 420 million light-years from the Milky Way that has been disrupted by the passage of a smaller galaxy. The interloper’s gravity pulled out the long tidal tail, which is about 280,000 light-years long, and triggered bursts of star formation seen as blue clumps along the tail. (e) Galaxies NGC 4676 A and B are nicknamed “The Mice.” In this Hubble Space Telescope image, you can see the long, narrow tails of stars pulled away from the galaxies by the interactions of the two spirals. (e) Arp 148 is a pair of galaxies that are caught in the act of merging to become one new galaxy. The two appear to have already passed through each other once, causing a shockwave that reformed one into a bright blue ring of star formation, like the ripples from a stone tossed into a pond. (credit a, b: modification of work by NRAO/AUI; credit c: modification of work by NASA, ESA, and The Hubble Heritage Team (STScI/AURA); credit d, e: modification of work by NASA, H. Ford (JHU), G. Illingworth (UCSC/LO), M.Clampin (STScI), G. Hartig (STScI), the ACS Science Team, and ESA; credit f: modification of work by NASA, ESA, the Hubble Heritage (STScI/AURA)-ESA/Hubble Collaboration, and A. Evans (University of Virginia, Charlottesville/NRAO/Stony Brook University))
Questions & Answers
Examine the distinction between theory of comparative cost Advantage and theory of factor proportion
In economics, a perfect market refers to a theoretical construct where all participants have perfect information, goods are homogenous, there are no barriers to entry or exit, and prices are determined solely by supply and demand. It's an idealized model used for analysis,
When MP₁ becomes negative, TP start to decline.
Extuples Suppose that the short-run production function of certain cut-flower firm is given by: Q=4KL-0.6K2 - 0.112 •
Where is quantity of cut flower produced, I is labour input and K is fixed capital input (K-5). Determine the average product of lab
Kelo
Extuples Suppose that the short-run production function of certain cut-flower firm is given by: Q=4KL-0.6K2 - 0.112 •
Where is quantity of cut flower produced, I is labour input and K is fixed capital input (K-5). Determine the average product of labour (APL) and marginal product of labour (MPL)
Quantity demanded refers to the specific amount of a good or service that consumers are willing and able to purchase at a give price and within a specific time period. Demand, on the other hand, is a broader concept that encompasses the entire relationship between price and quantity demanded
Ezea
ok
Shukri
how do you save a country economic situation when it's falling apart
Economic growth as an increase in the production and consumption of goods and services within an economy.but
Economic development as a broader concept that encompasses not only economic growth but also social & human well being.
Shukri
production function means
Jabir
What do you think is more important to focus on when considering inequality ?
sir...I just want to ask one question... Define the term contract curve? if you are free please help me to find this answer 🙏
Asui
it is a curve that we get after connecting the pareto optimal combinations of two consumers after their mutually beneficial trade offs
Awais
thank you so much 👍 sir
Asui
In economics, the contract curve refers to the set of points in an Edgeworth box diagram where both parties involved in a trade cannot be made better off without making one of them worse off. It represents the Pareto efficient allocations of goods between two individuals or entities, where neither p
Cornelius
In economics, the contract curve refers to the set of points in an Edgeworth box diagram where both parties involved in a trade cannot be made better off without making one of them worse off. It represents the Pareto efficient allocations of goods between two individuals or entities,
Cornelius
Got questions? Join the online conversation and get instant answers!