<< Chapter < Page Chapter >> Page >

Learning objectives

By the end of this section, you will be able to:

  • Describe the structure of the Milky Way Galaxy and how astronomers discovered it
  • Compare theoretical models for the formation of spiral arms in disk galaxies

Astronomers were able to make tremendous progress in mapping the spiral structure of the Milky Way after the discovery of the 21-cm line that comes from cool hydrogen (see Between the Stars: Gas and Dust in Space ). Remember that the obscuring effect of interstellar dust prevents us from seeing stars at large distances in the disk at visible wavelengths. However, radio waves of 21-cm wavelength pass right through the dust, enabling astronomers to detect hydrogen atoms throughout the Galaxy. More recent surveys of the infrared emission from stars in the disk have provided a similar dust-free perspective of our Galaxy’s stellar distribution. Despite all this progress over the past fifty years, we are still just beginning to pin down the precise structure of our Galaxy.

The arms of the milky way

Our radio observations of the disk’s gaseous component indicate that the Galaxy has two major spiral arms that emerge from the bar and several fainter arms and shorter spurs. You can see a recently assembled map of our Galaxy’s arm structure—derived from studies in the infrared—in [link] .

Milky way bar and arms.

Map of the The Milky Way Galaxy. Over-plotted on this data-based illustration of the Milky Way is a coordinate system centered on the Sun, which is located about half way from the center and the bottom of the image. It is a polar coordinate system, with zero degrees straight up from the Sun, 90O to the left, 180O straight down and 270O to the right. Distances are shown as circles of increasing radius centered on the Sun. Distances from 15,000 ly to 75,000 ly are indicated in increments of 5,000 ly. Moving outward from the Sun along the zero degree line are the “Near 3kpc Arm”, “Far 3 kpc Arm” and the “Sagittarius Arm”. Moving outward from the Sun along the 330O line (to the right of zero) are the “Norma Arm” and the “Scutum-Centaurus Arm”. Moving outward from the Sun along the 90O line are are the: “Orion Spur”, “Perseus Arm” and the “Outer Arm”.
Here, we see the Milky Way Galaxy as it would look from above. This image, assembled from data from NASA’s WISE mission, shows that the Milky Way Galaxy has a modest bar in its central regions. Two spiral arms, Scutum-Centaurus and Perseus, emerge from the ends of the bar and wrap around the bulge. The Sagittarius and Outer arms have fewer stars than the other two arms. (credit: modification of work by NASA/JPL-Caltech/R. Hurt (SSC/Caltech))

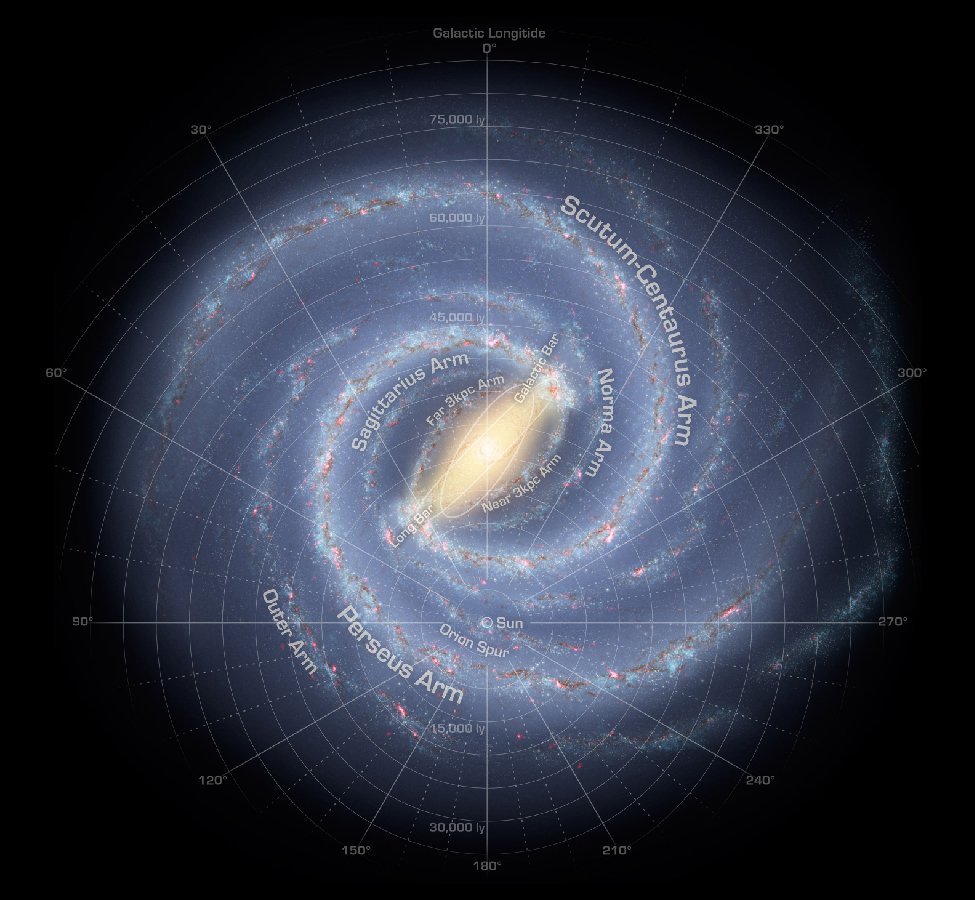
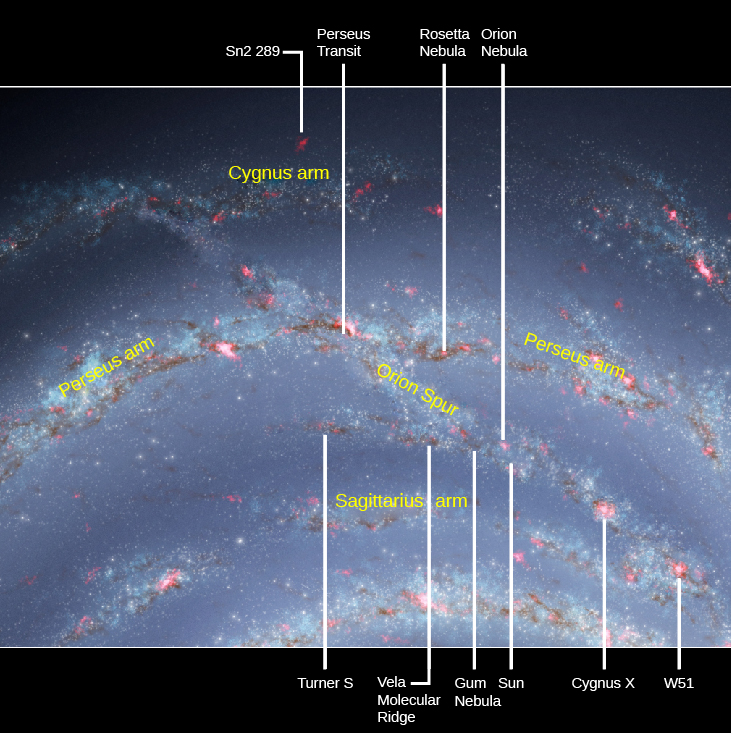
The Sun is near the inner edge of a short arm called the Orion Spur, which is about 10,000 light-years long and contains such conspicuous features as the Cygnus Rift (the great dark nebula in the summer Milky Way) and the bright Orion Nebula . [link] shows a few other objects that share this small section of the Galaxy with us and are easy to see. Remember, the farther away we try to look from our own arm, the more the dust in the Galaxy builds up and makes it hard to see with visible light.

Orion spur.

The Sun and the Orion Spur. Portions of three spiral arms of the Milky Way are shown in this illustration. The “Cygnus arm” at top, the “Perseus arm” at center and the “Sagittarius arm” at bottom. The “Orion spur” is a stream of stars and gas runs from the Cygnus arm diagonally downward to the right through the Perseus arm and on to the Sagittarius arm. The Sun is located in the portion of the spur between the Perseus and Sagittarius arms. Objects of interest are indicated with arrows from above and below the figure. At top, from left to right are: “Sn2 289”, “Perseus transit”, “Rosetta nebula” and the “Orion nebula”. At bottom, from left to right are: “Turner S”, “Vela molecular ridge”, “Gum nebula”, “Sun”, “Cygnus X-1” and “W51”.
The Sun is located in the Orion Spur, which is a minor spiral arm located between two other arms. In this diagram, the white lines point to some other noteworthy objects that share this feature of the Milky Way Galaxy with the Sun. (credit: modification of work by NASA/JPL-Caltech)

Formation of spiral structure

At the Sun’s distance from its center, the Galaxy does not rotate like a solid wheel or a CD inside your player. Instead, the way individual objects turn around the center of the Galaxy is more like the solar system. Stars, as well as the clouds of gas and dust, obey Kepler’s third law. Objects farther from the center take longer to complete an orbit around the Galaxy than do those closer to the center. In other words, stars (and interstellar matter) in larger orbits in the Galaxy trail behind those in smaller ones. This effect is called differential galactic rotation    .

Questions & Answers

What is inflation
Bright Reply
a general and ongoing rise in the level of prices in an economy
AI-Robot
What are the factors that affect demand for a commodity
Florence Reply
price
Kenu
differentiate between demand and supply giving examples
Lambiv Reply
differentiated between demand and supply using examples
Lambiv
what is labour ?
Lambiv
how will I do?
Venny Reply
how is the graph works?I don't fully understand
Rezat Reply
information
Eliyee
devaluation
Eliyee
t
WARKISA
hi guys good evening to all
Lambiv
multiple choice question
Aster Reply
appreciation
Eliyee
explain perfect market
Lindiwe Reply
In economics, a perfect market refers to a theoretical construct where all participants have perfect information, goods are homogenous, there are no barriers to entry or exit, and prices are determined solely by supply and demand. It's an idealized model used for analysis,
Ezea
What is ceteris paribus?
Shukri Reply
other things being equal
AI-Robot
When MP₁ becomes negative, TP start to decline. Extuples Suppose that the short-run production function of certain cut-flower firm is given by: Q=4KL-0.6K2 - 0.112 • Where is quantity of cut flower produced, I is labour input and K is fixed capital input (K-5). Determine the average product of lab
Kelo
Extuples Suppose that the short-run production function of certain cut-flower firm is given by: Q=4KL-0.6K2 - 0.112 • Where is quantity of cut flower produced, I is labour input and K is fixed capital input (K-5). Determine the average product of labour (APL) and marginal product of labour (MPL)
Kelo
yes,thank you
Shukri
Can I ask you other question?
Shukri
what is monopoly mean?
Habtamu Reply
What is different between quantity demand and demand?
Shukri Reply
Quantity demanded refers to the specific amount of a good or service that consumers are willing and able to purchase at a give price and within a specific time period. Demand, on the other hand, is a broader concept that encompasses the entire relationship between price and quantity demanded
Ezea
ok
Shukri
how do you save a country economic situation when it's falling apart
Lilia Reply
what is the difference between economic growth and development
Fiker Reply
Economic growth as an increase in the production and consumption of goods and services within an economy.but Economic development as a broader concept that encompasses not only economic growth but also social & human well being.
Shukri
production function means
Jabir
What do you think is more important to focus on when considering inequality ?
Abdisa Reply
any question about economics?
Awais Reply
sir...I just want to ask one question... Define the term contract curve? if you are free please help me to find this answer 🙏
Asui
it is a curve that we get after connecting the pareto optimal combinations of two consumers after their mutually beneficial trade offs
Awais
thank you so much 👍 sir
Asui
In economics, the contract curve refers to the set of points in an Edgeworth box diagram where both parties involved in a trade cannot be made better off without making one of them worse off. It represents the Pareto efficient allocations of goods between two individuals or entities, where neither p
Cornelius
In economics, the contract curve refers to the set of points in an Edgeworth box diagram where both parties involved in a trade cannot be made better off without making one of them worse off. It represents the Pareto efficient allocations of goods between two individuals or entities,
Cornelius
Suppose a consumer consuming two commodities X and Y has The following utility function u=X0.4 Y0.6. If the price of the X and Y are 2 and 3 respectively and income Constraint is birr 50. A,Calculate quantities of x and y which maximize utility. B,Calculate value of Lagrange multiplier. C,Calculate quantities of X and Y consumed with a given price. D,alculate optimum level of output .
Feyisa Reply
Answer
Feyisa
c
Jabir
Got questions? Join the online conversation and get instant answers!
Jobilize.com Reply
Practice Key Terms 2

Get Jobilize Job Search Mobile App in your pocket Now!

Get it on Google Play Download on the App Store Now


Source:  OpenStax, Astronomy. OpenStax CNX. Apr 12, 2017 Download for free at http://cnx.org/content/col11992/1.13
Google Play and the Google Play logo are trademarks of Google Inc.

Notification Switch

Would you like to follow the 'Astronomy' conversation and receive update notifications?

Ask