

| << Chapter < Page | Chapter >> Page > |
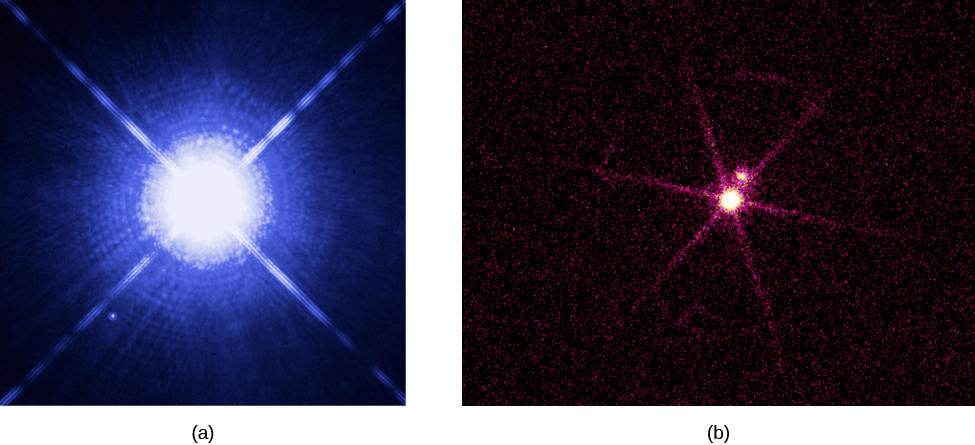
Using the Hubble Space Telescope, astronomers were able to detect images of faint white dwarf stars and other “stellar corpses” in the M4 star cluster, located about 7200 light-years away.
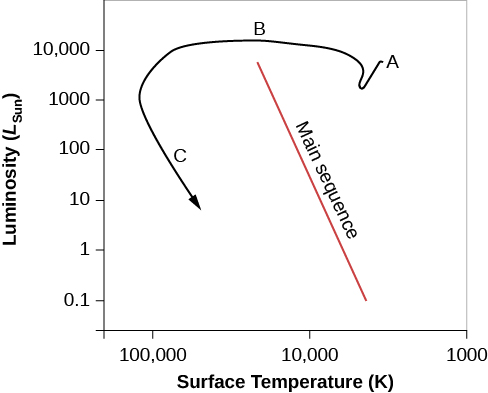
If the birth of a main-sequence star is defined by the onset of fusion reactions, then we must consider the end of all fusion reactions to be the time of a star’s death. As the core is stabilized by degeneracy pressure, a last shudder of fusion passes through the outside of the star, consuming the little hydrogen still remaining. Now the star is a true white dwarf: nuclear fusion in its interior has ceased. [link] shows the path of a star like the Sun on the H–R diagram during its final stages.
Since a stable white dwarf can no longer contract or produce energy through fusion, its only energy source is the heat represented by the motions of the atomic nuclei in its interior. The light it emits comes from this internal stored heat, which is substantial. Gradually, however, the white dwarf radiates away all its heat into space. After many billions of years, the nuclei will be moving much more slowly, and the white dwarf will no longer shine ( [link] ). It will then be a black dwarf —a cold stellar corpse with the mass of a star and the size of a planet. It will be composed mostly of carbon, oxygen, and neon, the products of the most advanced fusion reactions of which the star was capable.
We have one final surprise as we leave our low-mass star in the stellar graveyard. Calculations show that as a degenerate star cools, the atoms inside it in essence “solidify” into a giant, highly compact lattice (organized rows of atoms, just like in a crystal). When carbon is compressed and crystallized in this way, it becomes a giant diamond-like star. A white dwarf star might make the most impressive engagement present you could ever see, although any attempt to mine the diamond-like material inside would crush an ardent lover instantly!
Learn about a recent “diamond star” find, a cold, white dwarf star detected in 2014, which is considered the coldest and dimmest found to date, at the website of the National Radio Astronomy Observatory.
Whether or not a star will become a white dwarf depends on how much mass is lost in the red-giant and earlier phases of evolution. All stars that have masses below the Chandrasekhar limit when they run out of fuel will become white dwarfs, no matter what mass they were born with. But which stars shed enough mass to reach this limit?
One strategy for answering this question is to look in young, open cluster s (which were discussed in Star Clusters ). The basic idea is to search for young clusters that contain one or more white dwarf stars. Remember that more massive stars go through all stages of their evolution more rapidly than less massive ones. Suppose we find a cluster that has a white dwarf member and also contains stars on the main sequence that have 6 times the mass of the Sun. This means that only those stars with masses greater than 6 M Sun have had time to exhaust their supply of nuclear energy and complete their evolution to the white dwarf stage. The star that turned into the white dwarf must therefore have had a main-sequence mass of more than 6 M Sun , since stars with lower masses have not yet had time to use up their stores of nuclear energy. The star that became the white dwarf must, therefore, have gotten rid of at least 4.6 M Sun so that its mass at the time nuclear energy generation ceased could be less than 1.4 M Sun .
Astronomers continue to search for suitable clusters to make this test, and the evidence so far suggests that stars with masses up to about 8 M Sun can shed enough mass to end their lives as white dwarfs. Stars like the Sun will probably lose about 45% of their initial mass and become white dwarfs with masses less than 1.4 M Sun .
During the course of their evolution, stars shed their outer layers and lose a significant fraction of their initial mass. Stars with masses of 8 M Sun or less can lose enough mass to become white dwarfs, which have masses less than the Chandrasekhar limit (about 1.4 M Sun ). The pressure exerted by degenerate electrons keeps white dwarfs from contracting to still-smaller diameters. Eventually, white dwarfs cool off to become black dwarf s, stellar remnants made mainly of carbon, oxygen, and neon.
Notification Switch
Would you like to follow the 'Astronomy' conversation and receive update notifications?

|
|

|
|

|
|
|
|
|

|
|

|
|

|
|

|
|

|
|

|