<< Chapter < Page Chapter >> Page >

Measuring three or four evenly spaced transits is normally enough to “discover” an exoplanet. But in a new field like exoplanet research, we would like to find further independent verification. The strongest confirmation happens when ground-based telescopes are also able to detect a Doppler shift with the same period as the transits. However, this is generally not possible for Earth-size planets. One of the most convincing ways to verify that a dip in brightness is due to a planet is to find more planets orbiting the same star—a planetary system . Multi-planet systems also provide alternative ways to estimate the masses of the planets, as we will discuss in the next section.

The selection effects (or biases) in the Kepler data are similar to those in Doppler observations. Large planets are easier to find than small ones, and short-period planets are easier than long-period planets. If we require three transits to establish the presence of a planet, we are of course limited to discovering planets with orbital periods less than one-third of the observing interval. Thus, it was only in its fourth and final year of operation that Kepler was able to find planets with orbits like Earth’s that require 1 year to go around their star.

Direct detection

The best possible evidence for an earthlike planet elsewhere would be an image. After all, “seeing is believing” is a very human prejudice. But imaging a distant planet is a formidable challenge indeed. Suppose, for example, you were a great distance away and wished to detect reflected light from Earth. Earth intercepts and reflects less than one billionth of the Sun’s radiation, so its apparent brightness in visible light is less than one billionth that of the Sun. Compounding the challenge of detecting such a faint speck of light, the planet is swamped by the blaze of radiation from its parent star.

Even today, the best telescope mirrors’ optics have slight imperfections that prevent the star’s light from coming into focus in a completely sharp point.

Direct imaging works best for young gas giant planets that emit infrared light and reside at large separations from their host stars. Young giant planets emit more infrared light because they have more internal energy, stored from the process of planet formation. Even then, clever techniques must be employed to subtract out the light from the host star. In 2008, three such young planets were discovered orbiting HR 8799, a star in the constellation of Pegasus ( [link] ). Two years later, a fourth planet was detected closer to the star. Additional planets may reside even closer to HR 8799, but if they exist, they are currently lost in the glare of the star.

Since then, a number of planets around other stars have been found using direct imaging. However, one challenge is to tell whether the objects we are seeing are indeed planets or if they are brown dwarfs (failed stars) in orbit around a star.

Exoplanets around hr 8799.

Image of Exoplanets Around HR 8799. In this image North is up and East is to the left. At center is the position of the star, which has been removed from the image to reveal the planets. Scattered around the center are the 4 directly imaged planets, with 3 on the right and one on the left. Each has a semi-circular arrow attached indicating its direction of motion around the star. At lower right a scale of 20 AU / 0.5” is shown.
This image shows Keck telescope observations of four directly imaged planets orbiting HR 8799. A size scale for the system gives the distance in AU (remember that one astronomical unit is the distance between Earth and the Sun.) (credit: modification of work by Ben Zuckerman)

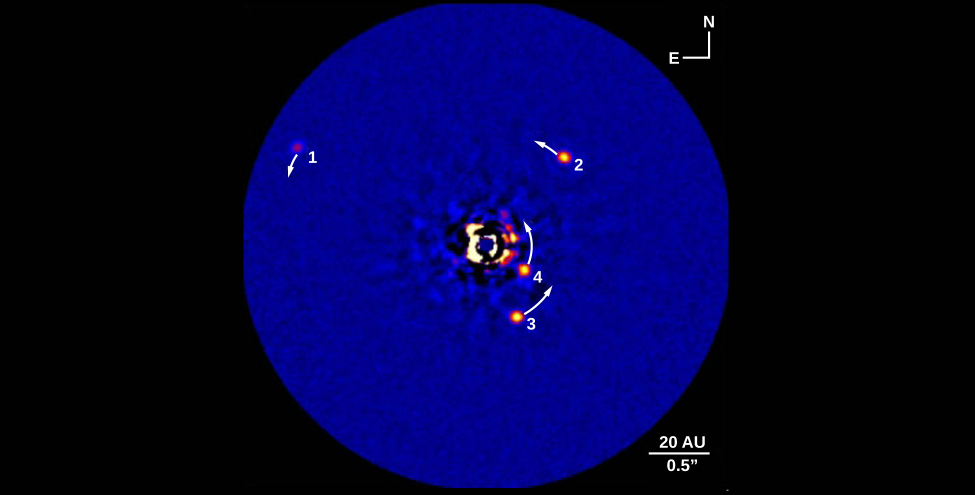
Direct imaging is an important technique for characterizing an exoplanet. The brightness of the planet can be measured at different wavelengths. These observations provide an estimate for the temperature of the planet’s atmosphere; in the case of HR 8799 planet 1, the color suggests the presence of thick clouds. Spectra can also be obtained from the faint light to analyze the atmospheric constituents. A spectrum of HR 8799 planet 1 indicates a hydrogen-rich atmosphere, while the closer planet 4 shows evidence for methane in the atmosphere.

Another way to overcome the blurring effect of Earth’s atmosphere is to observe from space. Infrared may be the optimal wavelength range in which to observe because planets get brighter in the infrared while stars like our Sun get fainter, thereby making it easier to detect a planet against the glare of its star. Special optical techniques can be used to suppress the light from the central star and make it easier to see the planet itself. However, even if we go into space, it will be difficult to obtain images of Earth-size planets.

Key concepts and summary

Several observational techniques have successfully detected planets orbiting other stars. These techniques fall into two general categories—direct and indirect detection. The Doppler and transit techniques are our most powerful indirect tools for finding exoplanets. Some planets are also being found by direct imaging.

Questions & Answers

What is inflation
Bright Reply
a general and ongoing rise in the level of prices in an economy
AI-Robot
What are the factors that affect demand for a commodity
Florence Reply
price
Kenu
differentiate between demand and supply giving examples
Lambiv Reply
differentiated between demand and supply using examples
Lambiv
what is labour ?
Lambiv
how will I do?
Venny Reply
how is the graph works?I don't fully understand
Rezat Reply
information
Eliyee
devaluation
Eliyee
t
WARKISA
hi guys good evening to all
Lambiv
multiple choice question
Aster Reply
appreciation
Eliyee
explain perfect market
Lindiwe Reply
In economics, a perfect market refers to a theoretical construct where all participants have perfect information, goods are homogenous, there are no barriers to entry or exit, and prices are determined solely by supply and demand. It's an idealized model used for analysis,
Ezea
What is ceteris paribus?
Shukri Reply
other things being equal
AI-Robot
When MP₁ becomes negative, TP start to decline. Extuples Suppose that the short-run production function of certain cut-flower firm is given by: Q=4KL-0.6K2 - 0.112 • Where is quantity of cut flower produced, I is labour input and K is fixed capital input (K-5). Determine the average product of lab
Kelo
Extuples Suppose that the short-run production function of certain cut-flower firm is given by: Q=4KL-0.6K2 - 0.112 • Where is quantity of cut flower produced, I is labour input and K is fixed capital input (K-5). Determine the average product of labour (APL) and marginal product of labour (MPL)
Kelo
yes,thank you
Shukri
Can I ask you other question?
Shukri
what is monopoly mean?
Habtamu Reply
What is different between quantity demand and demand?
Shukri Reply
Quantity demanded refers to the specific amount of a good or service that consumers are willing and able to purchase at a give price and within a specific time period. Demand, on the other hand, is a broader concept that encompasses the entire relationship between price and quantity demanded
Ezea
ok
Shukri
how do you save a country economic situation when it's falling apart
Lilia Reply
what is the difference between economic growth and development
Fiker Reply
Economic growth as an increase in the production and consumption of goods and services within an economy.but Economic development as a broader concept that encompasses not only economic growth but also social & human well being.
Shukri
production function means
Jabir
What do you think is more important to focus on when considering inequality ?
Abdisa Reply
any question about economics?
Awais Reply
sir...I just want to ask one question... Define the term contract curve? if you are free please help me to find this answer 🙏
Asui
it is a curve that we get after connecting the pareto optimal combinations of two consumers after their mutually beneficial trade offs
Awais
thank you so much 👍 sir
Asui
In economics, the contract curve refers to the set of points in an Edgeworth box diagram where both parties involved in a trade cannot be made better off without making one of them worse off. It represents the Pareto efficient allocations of goods between two individuals or entities, where neither p
Cornelius
In economics, the contract curve refers to the set of points in an Edgeworth box diagram where both parties involved in a trade cannot be made better off without making one of them worse off. It represents the Pareto efficient allocations of goods between two individuals or entities,
Cornelius
Suppose a consumer consuming two commodities X and Y has The following utility function u=X0.4 Y0.6. If the price of the X and Y are 2 and 3 respectively and income Constraint is birr 50. A,Calculate quantities of x and y which maximize utility. B,Calculate value of Lagrange multiplier. C,Calculate quantities of X and Y consumed with a given price. D,alculate optimum level of output .
Feyisa Reply
Answer
Feyisa
c
Jabir
Got questions? Join the online conversation and get instant answers!
Jobilize.com Reply
Practice Key Terms 2

Get Jobilize Job Search Mobile App in your pocket Now!

Get it on Google Play Download on the App Store Now


Source:  OpenStax, Astronomy. OpenStax CNX. Apr 12, 2017 Download for free at http://cnx.org/content/col11992/1.13
Google Play and the Google Play logo are trademarks of Google Inc.

Notification Switch

Would you like to follow the 'Astronomy' conversation and receive update notifications?

Ask