<< Chapter < Page Chapter >> Page >

Learning objectives

By the end of this section, you will be able to:

  • Describe the radio and X-ray observations that indicate energetic phenomena are occurring at the galactic center
  • Explain what has been revealed by high-resolution near-infrared imaging of the galactic center
  • Discuss how these near-infrared images, when combined with Kepler’s third law of motion, can be used to derive the mass of the central gravitating object

At the beginning of this chapter, we hinted that the core of our Galaxy contains a large concentration of mass. In fact, we now have evidence that the very center contains a black hole    with a mass equivalent to 4.6 million Suns and that all this mass fits within a sphere that has less than the diameter of Mercury’s orbit. Such monster black holes are called supermassive black holes by astronomers, to indicate that the mass they contain is far greater than that of the typical black hole created by the death of a single star. It is amazing that we have very convincing evidence that this black hole really does exist. After all, recall from the chapter on Black Holes and Curved Spacetime that we cannot see a black hole directly because by definition it radiates no energy. And we cannot even see into the center of the Galaxy in visible light because of absorption by the interstellar dust that lies between us and the galactic center. Light from the central region of the Galaxy is dimmed by a factor of a trillion (10 12 ) by all this dust.

Fortunately, we are not so blind at other wavelengths. Infrared and radio radiation, which have long wavelengths compared to the sizes of the interstellar dust grains, flow unimpeded past the dust particles and so reach our telescopes with hardly any dimming. In fact, the very bright radio source in the nucleus of the Galaxy, now known as Sagittarius A* (pronounced “Sagittarius A-star” and abbreviated Sgr A*), was the first cosmic radio source astronomers discovered.

A journey toward the center

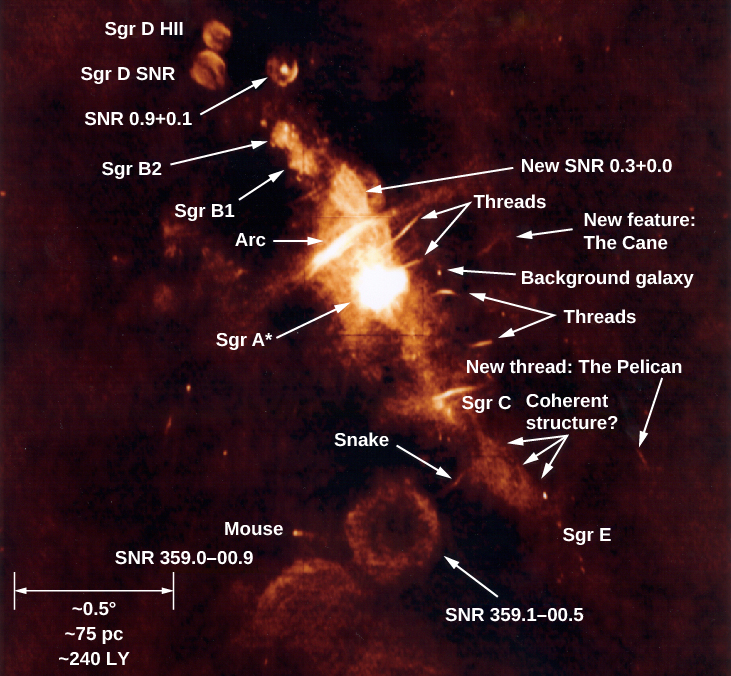
Let’s take a voyage to the mysterious heart of our Galaxy and see what’s there. [link] is a radio image of a region about 1500 light-years across, centered on Sagittarius A , a bright radio source that contains the smaller Sagittarius A * . Much of the radio emission comes from hot gas heated either by clusters of hot stars (the stars themselves do not produce radio emission and can’t be seen in the image) or by supernova blast waves. Most of the hollow circles visible on the radio image are supernova remnants. The other main source of radio emission is from electrons moving at high speed in regions with strong magnetic fields. The bright thin arcs and “threads” on the figure show us where this type of emission is produced.

Radio image of galactic center region.

Radio Image of Galactic Center Region. Many features are identified in this complex radio image. The scale at lower left (defined by a double headed horizontal arrow) reads: “~0.5O ~75 pc ~240 LY”. The objects listed, from upper left to lower right, are: “Sgr D HII”, “Sgr D SNR”, “SNR 0.9+0.1”, “Sgr B2”, “Sgr B1”, “New SNR 0.3+0.0”, “Arc”, “Threads”, “Sgr A*”, “New feature: The Cane”, “Background Galaxy”, “Threads”, “New thread: The Pelican”, “Sgr C”, “Coherent structure?”, “Snake” and “Sgr E”. Below center, three more features are labeled (from top to bottom): “SNR 359.1-00.5”, “Mouse” and “SNR 359.0=00.9”.
This radio map of the center of the Galaxy (at a wavelength of 90 centimeters) was constructed from data obtained with the Very Large Array (VLA) of radio telescopes in Socorro, New Mexico. Brighter regions are more intense in radio waves. The galactic center is inside the region labeled Sagittarius A . Sagittarius B1 and B2 are regions of active star formation. Many filaments or threadlike features are seen, as well as a number of shells (labeled SNR), which are supernova remnants. The scale bar at the bottom left is about 240 light-years long. Notice that radio astronomers also give fanciful animal names to some of the structures, much as visible-light nebulae are sometimes given the names of animals they resemble. (credit: modification of work by N. E. Kassim, D. S. Briggs, T. J. W. Lazio, T. N. LaRosa, and J. Imamura (NRL/RSD))

Questions & Answers

Examine the distinction between theory of comparative cost Advantage and theory of factor proportion
Fatima Reply
What is inflation
Bright Reply
a general and ongoing rise in the level of prices in an economy
AI-Robot
What are the factors that affect demand for a commodity
Florence Reply
price
Kenu
differentiate between demand and supply giving examples
Lambiv Reply
differentiated between demand and supply using examples
Lambiv
what is labour ?
Lambiv
how will I do?
Venny Reply
how is the graph works?I don't fully understand
Rezat Reply
information
Eliyee
devaluation
Eliyee
t
WARKISA
hi guys good evening to all
Lambiv
multiple choice question
Aster Reply
appreciation
Eliyee
explain perfect market
Lindiwe Reply
In economics, a perfect market refers to a theoretical construct where all participants have perfect information, goods are homogenous, there are no barriers to entry or exit, and prices are determined solely by supply and demand. It's an idealized model used for analysis,
Ezea
What is ceteris paribus?
Shukri Reply
other things being equal
AI-Robot
When MP₁ becomes negative, TP start to decline. Extuples Suppose that the short-run production function of certain cut-flower firm is given by: Q=4KL-0.6K2 - 0.112 • Where is quantity of cut flower produced, I is labour input and K is fixed capital input (K-5). Determine the average product of lab
Kelo
Extuples Suppose that the short-run production function of certain cut-flower firm is given by: Q=4KL-0.6K2 - 0.112 • Where is quantity of cut flower produced, I is labour input and K is fixed capital input (K-5). Determine the average product of labour (APL) and marginal product of labour (MPL)
Kelo
yes,thank you
Shukri
Can I ask you other question?
Shukri
what is monopoly mean?
Habtamu Reply
What is different between quantity demand and demand?
Shukri Reply
Quantity demanded refers to the specific amount of a good or service that consumers are willing and able to purchase at a give price and within a specific time period. Demand, on the other hand, is a broader concept that encompasses the entire relationship between price and quantity demanded
Ezea
ok
Shukri
how do you save a country economic situation when it's falling apart
Lilia Reply
what is the difference between economic growth and development
Fiker Reply
Economic growth as an increase in the production and consumption of goods and services within an economy.but Economic development as a broader concept that encompasses not only economic growth but also social & human well being.
Shukri
production function means
Jabir
What do you think is more important to focus on when considering inequality ?
Abdisa Reply
any question about economics?
Awais Reply
sir...I just want to ask one question... Define the term contract curve? if you are free please help me to find this answer 🙏
Asui
it is a curve that we get after connecting the pareto optimal combinations of two consumers after their mutually beneficial trade offs
Awais
thank you so much 👍 sir
Asui
In economics, the contract curve refers to the set of points in an Edgeworth box diagram where both parties involved in a trade cannot be made better off without making one of them worse off. It represents the Pareto efficient allocations of goods between two individuals or entities, where neither p
Cornelius
In economics, the contract curve refers to the set of points in an Edgeworth box diagram where both parties involved in a trade cannot be made better off without making one of them worse off. It represents the Pareto efficient allocations of goods between two individuals or entities,
Cornelius
Got questions? Join the online conversation and get instant answers!
Jobilize.com Reply
Practice Key Terms 1

Get Jobilize Job Search Mobile App in your pocket Now!

Get it on Google Play Download on the App Store Now


Source:  OpenStax, Astronomy. OpenStax CNX. Apr 12, 2017 Download for free at http://cnx.org/content/col11992/1.13
Google Play and the Google Play logo are trademarks of Google Inc.

Notification Switch

Would you like to follow the 'Astronomy' conversation and receive update notifications?

Ask