<< Chapter < Page Chapter >> Page >

The hope is that by the time of the next maximum, solar weather forecasting will have some of the predictive capability that meteorologists have achieved for terrestrial weather at Earth’s surface. However, the most difficult events to predict are the largest and most damaging storms—hurricanes on Earth and extreme, rare storm events on the Sun. Thus, it is inevitable that the Sun will continue to surprise us.

The timing of solar events

A basic equation is useful in figuring out when events on the Sun will impact Earth:

distance = velocity × time, or D = v × t

Dividing both sides by v , we get

T = D / v

Suppose you observe a major solar flare while astronauts are orbiting Earth. If the average speed of solar wind is 400 km/s and the distance to the Sun as 1.496 × 10 8 km, how long it will before the charged particles ejected from the Sun during the flare reach the space station?

Solution

The time required for solar wind particles to reach Earth is T = D / v .

1.496 × 10 8 km 400 km/s = 3.74 × 10 5 s , or 3.74 × 10 5 s 60 s/min × 60 min/h × 24 h/d = 4.3 d

Check your learning

How many days would it take for the particles to reach Earth if the solar wind speed increased to
500 km/s?

Answer:

1.496 × 10 8 km 500 km/s = 2.99 × 10 5 s , or 2.99 × 10 5 s 60 s/min × 60 min/h × 24 h/d = 3.46 d

Got questions? Get instant answers now!

Earth’s climate and the sunspot cycle: is there a connection?

While the Sun rises faithfully every day at a time that can be calculated precisely, scientists have determined that the Sun’s energy output is not truly constant but varies over the centuries by a small amount—probably less than 1%. We’ve seen that the number of sunspots varies, with the time between sunspot maxima of about 11 years, and that the number of sunspots at maximum is not always the same. Considerable evidence shows that between the years 1645 and 1715, the number of sunspots, even at sunspot maximum, was much lower than it is now. This interval of significantly low sunspot numbers was first noted by Gustav Spӧrer in 1887 and then by E. W. Maunder in 1890; it is now called the Maunder Minimum    . The variation in the number of sunspots over the past three centuries is shown in [link] . Besides the Maunder Minimum in the seventeenth century, sunspot numbers were somewhat lower during the first part of the nineteenth century than they are now; this period is called the Little Maunder Minimum.

Numbers of sunspots over time.

A graph titled “Monthly Average Sunspot Numbers”. The graph shows the number of sunspots on the y-axis (0 to 400) and the year on the x-axis (1750 to 2000). A scalloped line shows the rise and fall of sunspot numbers throughout the solar cycle.
This diagram shows how the number of sunspots has changed with time since counts of the numbers of spots began to be recorded on a consistent scale. Note the low number of spots during the early years of the nineteenth century, the Little Maunder Minimum. (credit: modification of work by NASA/ARC)

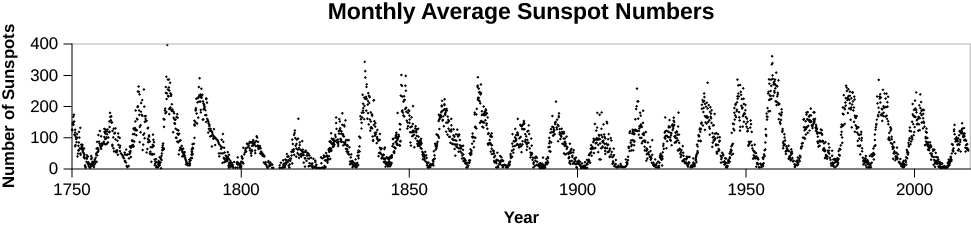
When the number of sunspots is high, the Sun is active in various other ways as well, and, as we will see in several sections below, some of this activity affects Earth directly. For example, there are more aurora    l displays when the sunspot number is high. Auroras are caused when energetically charged particles from the Sun interact with Earth’s magnetosphere    , and the Sun is more likely to spew out particles when it is active and the sunspot number is high. Historical accounts also indicate that auroral activity was abnormally low throughout the several decades of the Maunder Minimum.

Questions & Answers

What is inflation
Bright Reply
a general and ongoing rise in the level of prices in an economy
AI-Robot
What are the factors that affect demand for a commodity
Florence Reply
price
Kenu
differentiate between demand and supply giving examples
Lambiv Reply
differentiated between demand and supply using examples
Lambiv
what is labour ?
Lambiv
how will I do?
Venny Reply
how is the graph works?I don't fully understand
Rezat Reply
information
Eliyee
devaluation
Eliyee
t
WARKISA
hi guys good evening to all
Lambiv
multiple choice question
Aster Reply
appreciation
Eliyee
explain perfect market
Lindiwe Reply
In economics, a perfect market refers to a theoretical construct where all participants have perfect information, goods are homogenous, there are no barriers to entry or exit, and prices are determined solely by supply and demand. It's an idealized model used for analysis,
Ezea
What is ceteris paribus?
Shukri Reply
other things being equal
AI-Robot
When MP₁ becomes negative, TP start to decline. Extuples Suppose that the short-run production function of certain cut-flower firm is given by: Q=4KL-0.6K2 - 0.112 • Where is quantity of cut flower produced, I is labour input and K is fixed capital input (K-5). Determine the average product of lab
Kelo
Extuples Suppose that the short-run production function of certain cut-flower firm is given by: Q=4KL-0.6K2 - 0.112 • Where is quantity of cut flower produced, I is labour input and K is fixed capital input (K-5). Determine the average product of labour (APL) and marginal product of labour (MPL)
Kelo
yes,thank you
Shukri
Can I ask you other question?
Shukri
what is monopoly mean?
Habtamu Reply
What is different between quantity demand and demand?
Shukri Reply
Quantity demanded refers to the specific amount of a good or service that consumers are willing and able to purchase at a give price and within a specific time period. Demand, on the other hand, is a broader concept that encompasses the entire relationship between price and quantity demanded
Ezea
ok
Shukri
how do you save a country economic situation when it's falling apart
Lilia Reply
what is the difference between economic growth and development
Fiker Reply
Economic growth as an increase in the production and consumption of goods and services within an economy.but Economic development as a broader concept that encompasses not only economic growth but also social & human well being.
Shukri
production function means
Jabir
What do you think is more important to focus on when considering inequality ?
Abdisa Reply
any question about economics?
Awais Reply
sir...I just want to ask one question... Define the term contract curve? if you are free please help me to find this answer 🙏
Asui
it is a curve that we get after connecting the pareto optimal combinations of two consumers after their mutually beneficial trade offs
Awais
thank you so much 👍 sir
Asui
In economics, the contract curve refers to the set of points in an Edgeworth box diagram where both parties involved in a trade cannot be made better off without making one of them worse off. It represents the Pareto efficient allocations of goods between two individuals or entities, where neither p
Cornelius
In economics, the contract curve refers to the set of points in an Edgeworth box diagram where both parties involved in a trade cannot be made better off without making one of them worse off. It represents the Pareto efficient allocations of goods between two individuals or entities,
Cornelius
Suppose a consumer consuming two commodities X and Y has The following utility function u=X0.4 Y0.6. If the price of the X and Y are 2 and 3 respectively and income Constraint is birr 50. A,Calculate quantities of x and y which maximize utility. B,Calculate value of Lagrange multiplier. C,Calculate quantities of X and Y consumed with a given price. D,alculate optimum level of output .
Feyisa Reply
Answer
Feyisa
c
Jabir
Got questions? Join the online conversation and get instant answers!
Jobilize.com Reply

Get Jobilize Job Search Mobile App in your pocket Now!

Get it on Google Play Download on the App Store Now


Source:  OpenStax, Astronomy. OpenStax CNX. Apr 12, 2017 Download for free at http://cnx.org/content/col11992/1.13
Google Play and the Google Play logo are trademarks of Google Inc.

Notification Switch

Would you like to follow the 'Astronomy' conversation and receive update notifications?

Ask