<< Chapter < Page Chapter >> Page >

Solar storms also expose astronauts, passengers in high-flying airplanes, and even people on the surface of Earth to increased amounts of radiation. Astronauts, for example, are limited in the total amount of radiation to which they can be exposed during their careers. A single ill-timed solar outburst could end an astronaut’s career. This problem becomes increasingly serious as astronauts spend more time in space. For example, the typical daily dose of radiation aboard the Russian Mir space station was equivalent to about eight chest X-rays. One of the major challenges in planning the human exploration of Mars is devising a way to protect astronauts from high-energy solar radiation.

Advance warning of solar storms would help us minimize their disruptive effects. Power networks could be run at less than their full capacity so that they could absorb the effects of power surges. Communications networks could be prepared for malfunctions and have backup plans in place. Spacewalks could be timed to avoid major solar outbursts. Scientists are now trying to find ways to predict where and when flares and CMEs will occur, and whether they will be big, fast events or small, slow ones with little consequence for Earth.

The strategy is to relate changes in the appearance of small, active regions and changes in local magnetic fields on the Sun to subsequent eruptions. However, right now, our predictive capability is still poor, and so the only real warning we have is from actually seeing CMEs and flares occur. Since a CME travels outward at about 500 kilometers per second, an observation of an eruption provides several days warning at the distance of Earth. However, the severity of the impact on Earth depends on how the magnetic field associated with the CME is oriented relative to Earth’s magnetic field. The orientation can be measured only when the CME flows past a satellite we have put up for this purpose. However, it is located only about an hour upstream from Earth.

Space weather predictions are now available online to scientists and the public. Outlooks are given a week ahead, bulletins are issued when there is an event that is likely to be of interest to the public, and warnings and alerts are posted when an event is imminent or already under way ( [link] ).
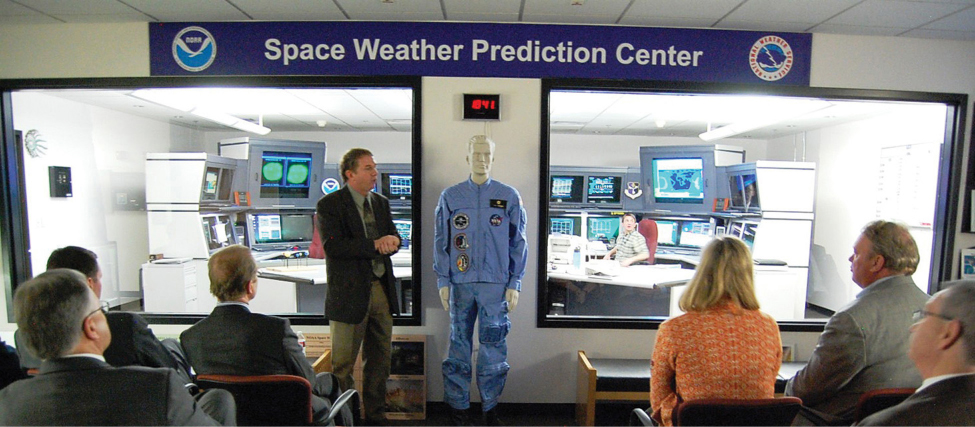
Noaa space weather prediction operations center.

An image of several seated people in a room with a banner reading “Space weather prediction Center.” At the front of the room a person stands and addresses the seated people.
Bill Murtagh, a space weather forecaster, leads a workshop on preparedness for events like geomagnetic storms. (credit: modification of work by FEMA/Jerry DeFelice)

Fortunately, we can expect calmer space weather for the next few years, since the most recent solar maximum , which was relatively weak, occurred in 2014, and scientists believe the current solar cycle to be one of the least active in recent history. We expect more satellites to be launched that will allow us to determine whether CMEs are headed toward Earth and how big they are. Models are being developed that will then allow scientists to use early information about the CME to predict its likely impact on Earth.

Questions & Answers

What is inflation
Bright Reply
a general and ongoing rise in the level of prices in an economy
AI-Robot
What are the factors that affect demand for a commodity
Florence Reply
price
Kenu
differentiate between demand and supply giving examples
Lambiv Reply
differentiated between demand and supply using examples
Lambiv
what is labour ?
Lambiv
how will I do?
Venny Reply
how is the graph works?I don't fully understand
Rezat Reply
information
Eliyee
devaluation
Eliyee
t
WARKISA
hi guys good evening to all
Lambiv
multiple choice question
Aster Reply
appreciation
Eliyee
explain perfect market
Lindiwe Reply
In economics, a perfect market refers to a theoretical construct where all participants have perfect information, goods are homogenous, there are no barriers to entry or exit, and prices are determined solely by supply and demand. It's an idealized model used for analysis,
Ezea
What is ceteris paribus?
Shukri Reply
other things being equal
AI-Robot
When MP₁ becomes negative, TP start to decline. Extuples Suppose that the short-run production function of certain cut-flower firm is given by: Q=4KL-0.6K2 - 0.112 • Where is quantity of cut flower produced, I is labour input and K is fixed capital input (K-5). Determine the average product of lab
Kelo
Extuples Suppose that the short-run production function of certain cut-flower firm is given by: Q=4KL-0.6K2 - 0.112 • Where is quantity of cut flower produced, I is labour input and K is fixed capital input (K-5). Determine the average product of labour (APL) and marginal product of labour (MPL)
Kelo
yes,thank you
Shukri
Can I ask you other question?
Shukri
what is monopoly mean?
Habtamu Reply
What is different between quantity demand and demand?
Shukri Reply
Quantity demanded refers to the specific amount of a good or service that consumers are willing and able to purchase at a give price and within a specific time period. Demand, on the other hand, is a broader concept that encompasses the entire relationship between price and quantity demanded
Ezea
ok
Shukri
how do you save a country economic situation when it's falling apart
Lilia Reply
what is the difference between economic growth and development
Fiker Reply
Economic growth as an increase in the production and consumption of goods and services within an economy.but Economic development as a broader concept that encompasses not only economic growth but also social & human well being.
Shukri
production function means
Jabir
What do you think is more important to focus on when considering inequality ?
Abdisa Reply
any question about economics?
Awais Reply
sir...I just want to ask one question... Define the term contract curve? if you are free please help me to find this answer 🙏
Asui
it is a curve that we get after connecting the pareto optimal combinations of two consumers after their mutually beneficial trade offs
Awais
thank you so much 👍 sir
Asui
In economics, the contract curve refers to the set of points in an Edgeworth box diagram where both parties involved in a trade cannot be made better off without making one of them worse off. It represents the Pareto efficient allocations of goods between two individuals or entities, where neither p
Cornelius
In economics, the contract curve refers to the set of points in an Edgeworth box diagram where both parties involved in a trade cannot be made better off without making one of them worse off. It represents the Pareto efficient allocations of goods between two individuals or entities,
Cornelius
Suppose a consumer consuming two commodities X and Y has The following utility function u=X0.4 Y0.6. If the price of the X and Y are 2 and 3 respectively and income Constraint is birr 50. A,Calculate quantities of x and y which maximize utility. B,Calculate value of Lagrange multiplier. C,Calculate quantities of X and Y consumed with a given price. D,alculate optimum level of output .
Feyisa Reply
Answer
Feyisa
c
Jabir
Got questions? Join the online conversation and get instant answers!
Jobilize.com Reply

Get Jobilize Job Search Mobile App in your pocket Now!

Get it on Google Play Download on the App Store Now


Source:  OpenStax, Astronomy. OpenStax CNX. Apr 12, 2017 Download for free at http://cnx.org/content/col11992/1.13
Google Play and the Google Play logo are trademarks of Google Inc.

Notification Switch

Would you like to follow the 'Astronomy' conversation and receive update notifications?

Ask