<< Chapter < Page Chapter >> Page >

Parts of the sun.

Interior Structure of the Sun. In this cutaway illustration of the Sun, a triangular wedge shaped portion has been removed from the upper half to expose the interior, with surface features shown in the lower half of the diagram. Interior features are labeled on the left hand side of the figure. In the interior, the core is labeled and drawn in blue. Next, the radiative zone is labeled and drawn as a gradient of color starting with yellow just outside the core, to orange and finally red marking the upper boundary. Several wavy arrows are drawn from the center of the core out to the red boundary of the radiative zone, representing the energy leaving the core and moving through the radiative zone. The convection zone is drawn as a thick yellow layer above the radiative zone. Oval arrows are drawn within the convection zone to indicate the vertical motion of the gas. Features are labeled on the left and right hand side of the figure: convection zone, prominence, radiative zone, core, corona, photosphere, sunspot, chromosphere, and coronal hole.
This illustration shows the different parts of the Sun, from the hot core where the energy is generated through regions where energy is transported outward, first by radiation, then by convection, and then out through the solar atmosphere. The parts of the atmosphere are also labeled the photosphere, chromosphere, and corona. Some typical features in the atmosphere are shown, such as coronal holes and prominences. (credit: modification of work by NASA/Goddard)

The Sun’s layers are different from each other, and each plays a part in producing the energy that the Sun ultimately emits. We will begin with the core and work our way out through the layers. The Sun’s core is extremely dense and is the source of all of its energy. Inside the core, nuclear energy is being released (in ways we will discuss in The Sun: A Nuclear Powerhouse ). The core is approximately 20% of the size of the solar interior and is thought to have a temperature of approximately 15 million K, making it the hottest part of the Sun.

Above the core is a region known as the radiative zone —named for the primary mode of transporting energy across it. This region starts at about 25% of the distance to the solar surface and extends up to about 70% of the way to the surface. The light generated in the core is transported through the radiative zone very slowly, since the high density of matter in this region means a photon cannot travel too far without encountering a particle, causing it to change direction and lose some energy.

The convective zone is the outermost layer of the solar interior. It is a thick layer approximately 200,000 kilometers deep that transports energy from the edge of the radiative zone to the surface through giant convection cells, similar to a pot of boiling oatmeal. The plasma at the bottom of the convective zone is extremely hot, and it bubbles to the surface where it loses its heat to space. Once the plasma cools, it sinks back to the bottom of the convective zone.

Now that we have given a quick overview of the structure of the whole Sun, in this section, we will embark on a journey through the visible layers of the Sun, beginning with the photosphere—the visible surface.

The solar photosphere

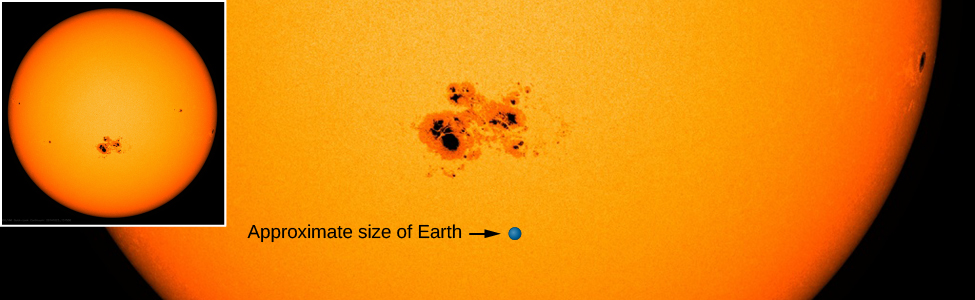
Earth’s air is generally transparent. But on a smoggy day in many cities, it can become opaque, which prevents us from seeing through it past a certain point. Something similar happens in the Sun. Its outer atmosphere is transparent, allowing us to look a short distance through it. But when we try to look through the atmosphere deeper into the Sun, our view is blocked. The photosphere    is the layer where the Sun becomes opaque and marks the boundary past which we cannot see ( [link] ).

Solar photosphere plus sunspots.

An image of the solar photosphere with sunspots. A close up of the lower half of the sun is shown, with a series of dark sunspots in the center. Below is a dot labeled “Approximate size of Earth” which is smaller than any individual sunspot. An inset shows an image of the entire sun with sunspots.
This photograph shows the photosphere—the visible surface of the Sun. Also shown is an enlarged image of a group of sunspots; the size of Earth is shown for comparison. Sunspots appear darker because they are cooler than their surroundings. The typical temperature at the center of a large sunspot is about 3800 K, whereas the photosphere has a temperature of about 5800 K. (credit: modification of work by NASA/SDO)

Questions & Answers

What is inflation
Bright Reply
a general and ongoing rise in the level of prices in an economy
AI-Robot
What are the factors that affect demand for a commodity
Florence Reply
price
Kenu
differentiate between demand and supply giving examples
Lambiv Reply
differentiated between demand and supply using examples
Lambiv
what is labour ?
Lambiv
how will I do?
Venny Reply
how is the graph works?I don't fully understand
Rezat Reply
information
Eliyee
devaluation
Eliyee
t
WARKISA
hi guys good evening to all
Lambiv
multiple choice question
Aster Reply
appreciation
Eliyee
explain perfect market
Lindiwe Reply
In economics, a perfect market refers to a theoretical construct where all participants have perfect information, goods are homogenous, there are no barriers to entry or exit, and prices are determined solely by supply and demand. It's an idealized model used for analysis,
Ezea
What is ceteris paribus?
Shukri Reply
other things being equal
AI-Robot
When MP₁ becomes negative, TP start to decline. Extuples Suppose that the short-run production function of certain cut-flower firm is given by: Q=4KL-0.6K2 - 0.112 • Where is quantity of cut flower produced, I is labour input and K is fixed capital input (K-5). Determine the average product of lab
Kelo
Extuples Suppose that the short-run production function of certain cut-flower firm is given by: Q=4KL-0.6K2 - 0.112 • Where is quantity of cut flower produced, I is labour input and K is fixed capital input (K-5). Determine the average product of labour (APL) and marginal product of labour (MPL)
Kelo
yes,thank you
Shukri
Can I ask you other question?
Shukri
what is monopoly mean?
Habtamu Reply
What is different between quantity demand and demand?
Shukri Reply
Quantity demanded refers to the specific amount of a good or service that consumers are willing and able to purchase at a give price and within a specific time period. Demand, on the other hand, is a broader concept that encompasses the entire relationship between price and quantity demanded
Ezea
ok
Shukri
how do you save a country economic situation when it's falling apart
Lilia Reply
what is the difference between economic growth and development
Fiker Reply
Economic growth as an increase in the production and consumption of goods and services within an economy.but Economic development as a broader concept that encompasses not only economic growth but also social & human well being.
Shukri
production function means
Jabir
What do you think is more important to focus on when considering inequality ?
Abdisa Reply
any question about economics?
Awais Reply
sir...I just want to ask one question... Define the term contract curve? if you are free please help me to find this answer 🙏
Asui
it is a curve that we get after connecting the pareto optimal combinations of two consumers after their mutually beneficial trade offs
Awais
thank you so much 👍 sir
Asui
In economics, the contract curve refers to the set of points in an Edgeworth box diagram where both parties involved in a trade cannot be made better off without making one of them worse off. It represents the Pareto efficient allocations of goods between two individuals or entities, where neither p
Cornelius
In economics, the contract curve refers to the set of points in an Edgeworth box diagram where both parties involved in a trade cannot be made better off without making one of them worse off. It represents the Pareto efficient allocations of goods between two individuals or entities,
Cornelius
Suppose a consumer consuming two commodities X and Y has The following utility function u=X0.4 Y0.6. If the price of the X and Y are 2 and 3 respectively and income Constraint is birr 50. A,Calculate quantities of x and y which maximize utility. B,Calculate value of Lagrange multiplier. C,Calculate quantities of X and Y consumed with a given price. D,alculate optimum level of output .
Feyisa Reply
Answer
Feyisa
c
Jabir
Got questions? Join the online conversation and get instant answers!
Jobilize.com Reply
Practice Key Terms 9

Get Jobilize Job Search Mobile App in your pocket Now!

Get it on Google Play Download on the App Store Now


Source:  OpenStax, Astronomy. OpenStax CNX. Apr 12, 2017 Download for free at http://cnx.org/content/col11992/1.13
Google Play and the Google Play logo are trademarks of Google Inc.

Notification Switch

Would you like to follow the 'Astronomy' conversation and receive update notifications?

Ask