<< Chapter < Page Chapter >> Page >

Measurement of blood pressure

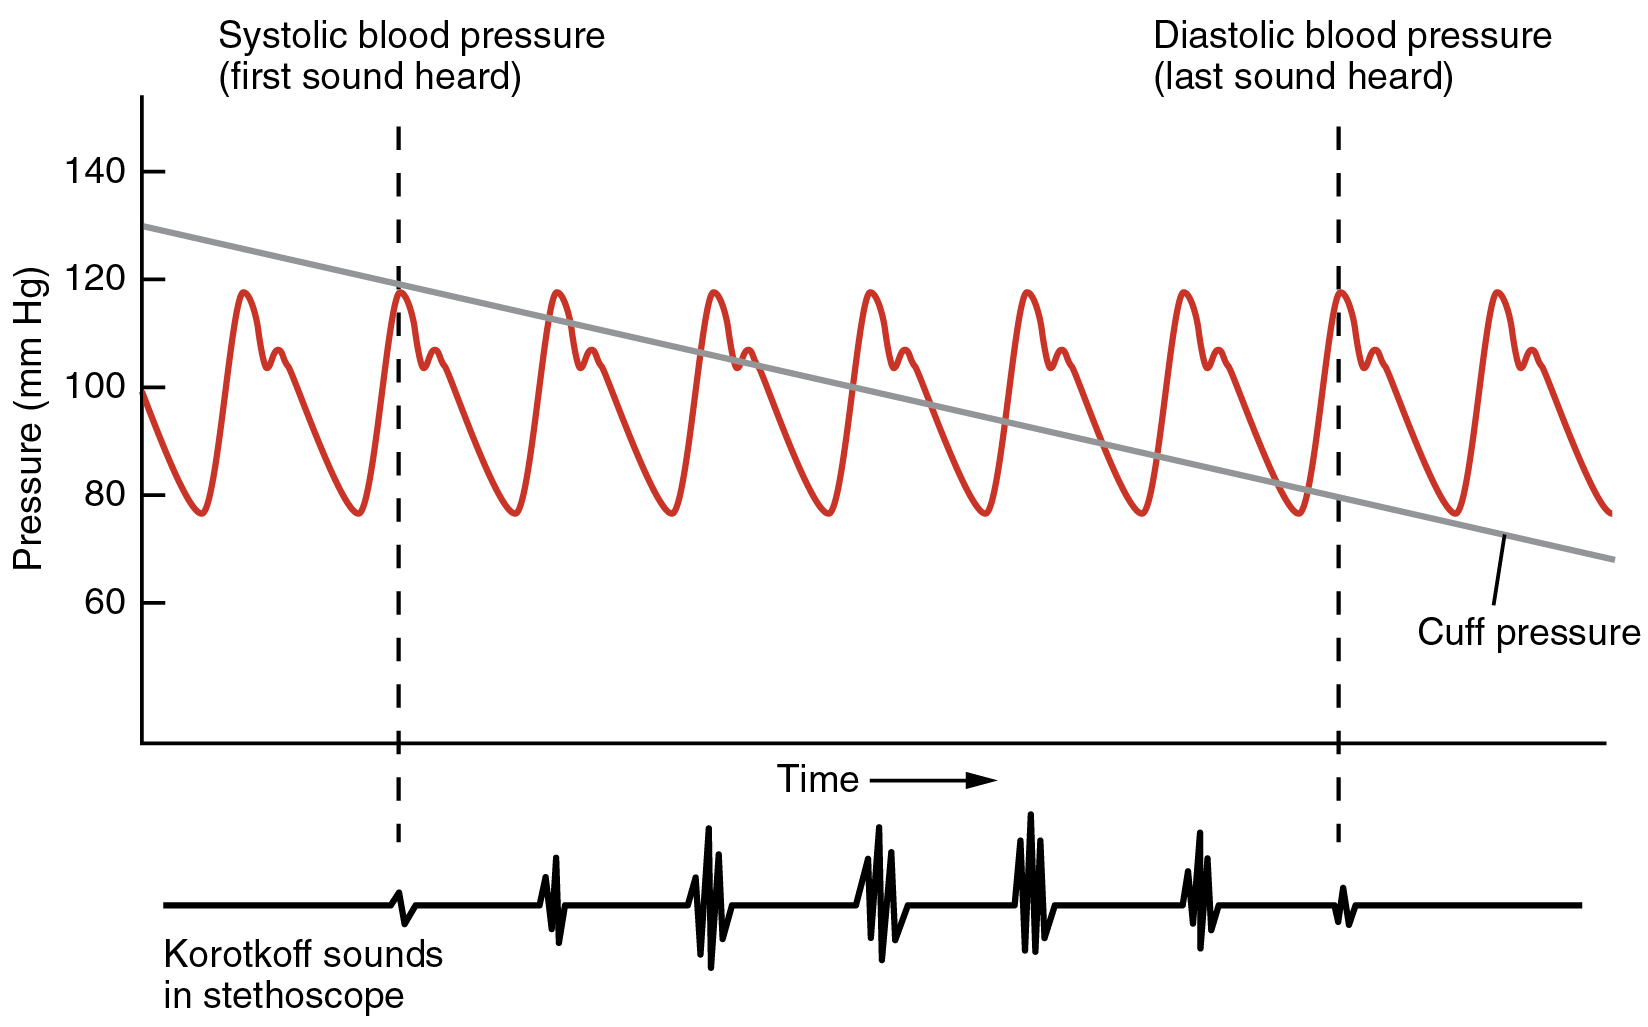
Blood pressure is one of the critical parameters measured on virtually every patient in every healthcare setting. The technique used today was developed more than 100 years ago by a pioneering Russian physician, Dr. Nikolai Korotkoff. Turbulent blood flow through the vessels can be heard as a soft ticking while measuring blood pressure; these sounds are known as Korotkoff sounds    . The technique of measuring blood pressure requires the use of a sphygmomanometer    (a blood pressure cuff attached to a measuring device) and a stethoscope. The technique is as follows:

  • The clinician wraps an inflatable cuff tightly around the patient’s arm at about the level of the heart.
  • The clinician squeezes a rubber pump to inject air into the cuff, raising pressure around the artery and temporarily cutting off blood flow into the patient’s arm.
  • The clinician places the stethoscope on the patient’s antecubital region and, while gradually allowing air within the cuff to escape, listens for the Korotkoff sounds.

Although there are five recognized Korotkoff sounds, only two are normally recorded. Initially, no sounds are heard since there is no blood flow through the vessels, but as air pressure drops, the cuff relaxes, and blood flow returns to the arm. As shown in [link] , the first sound heard through the stethoscope—the first Korotkoff sound—indicates systolic pressure. As more air is released from the cuff, blood is able to flow freely through the brachial artery and all sounds disappear. The point at which the last sound is heard is recorded as the patient’s diastolic pressure.

Blood pressure measurement

This image shows blood pressure as a function of time.
When pressure in a sphygmomanometer cuff is released, a clinician can hear the Korotkoff sounds. In this graph, a blood pressure tracing is aligned to a measurement of systolic and diastolic pressures.

The majority of hospitals and clinics have automated equipment for measuring blood pressure that work on the same principles. An even more recent innovation is a small instrument that wraps around a patient’s wrist. The patient then holds the wrist over the heart while the device measures blood flow and records pressure.

Variables affecting blood flow and blood pressure

Five variables influence blood flow and blood pressure:

  • Cardiac output
  • Compliance
  • Volume of the blood
  • Viscosity of the blood
  • Blood vessel length and diameter

Recall that blood moves from higher pressure to lower pressure. It is pumped from the heart into the arteries at high pressure. If you increase pressure in the arteries (afterload), and cardiac function does not compensate, blood flow will actually decrease. In the venous system, the opposite relationship is true. Increased pressure in the veins does not decrease flow as it does in arteries, but actually increases flow. Since pressure in the veins is normally relatively low, for blood to flow back into the heart, the pressure in the atria during atrial diastole must be even lower. It normally approaches zero, except when the atria contract (see [link] ).

Questions & Answers

What is inflation
Bright Reply
a general and ongoing rise in the level of prices in an economy
AI-Robot
What are the factors that affect demand for a commodity
Florence Reply
price
Kenu
differentiate between demand and supply giving examples
Lambiv Reply
differentiated between demand and supply using examples
Lambiv
what is labour ?
Lambiv
how will I do?
Venny Reply
how is the graph works?I don't fully understand
Rezat Reply
information
Eliyee
devaluation
Eliyee
t
WARKISA
hi guys good evening to all
Lambiv
multiple choice question
Aster Reply
appreciation
Eliyee
explain perfect market
Lindiwe Reply
In economics, a perfect market refers to a theoretical construct where all participants have perfect information, goods are homogenous, there are no barriers to entry or exit, and prices are determined solely by supply and demand. It's an idealized model used for analysis,
Ezea
What is ceteris paribus?
Shukri Reply
other things being equal
AI-Robot
When MP₁ becomes negative, TP start to decline. Extuples Suppose that the short-run production function of certain cut-flower firm is given by: Q=4KL-0.6K2 - 0.112 • Where is quantity of cut flower produced, I is labour input and K is fixed capital input (K-5). Determine the average product of lab
Kelo
Extuples Suppose that the short-run production function of certain cut-flower firm is given by: Q=4KL-0.6K2 - 0.112 • Where is quantity of cut flower produced, I is labour input and K is fixed capital input (K-5). Determine the average product of labour (APL) and marginal product of labour (MPL)
Kelo
yes,thank you
Shukri
Can I ask you other question?
Shukri
what is monopoly mean?
Habtamu Reply
What is different between quantity demand and demand?
Shukri Reply
Quantity demanded refers to the specific amount of a good or service that consumers are willing and able to purchase at a give price and within a specific time period. Demand, on the other hand, is a broader concept that encompasses the entire relationship between price and quantity demanded
Ezea
ok
Shukri
how do you save a country economic situation when it's falling apart
Lilia Reply
what is the difference between economic growth and development
Fiker Reply
Economic growth as an increase in the production and consumption of goods and services within an economy.but Economic development as a broader concept that encompasses not only economic growth but also social & human well being.
Shukri
production function means
Jabir
What do you think is more important to focus on when considering inequality ?
Abdisa Reply
any question about economics?
Awais Reply
sir...I just want to ask one question... Define the term contract curve? if you are free please help me to find this answer 🙏
Asui
it is a curve that we get after connecting the pareto optimal combinations of two consumers after their mutually beneficial trade offs
Awais
thank you so much 👍 sir
Asui
In economics, the contract curve refers to the set of points in an Edgeworth box diagram where both parties involved in a trade cannot be made better off without making one of them worse off. It represents the Pareto efficient allocations of goods between two individuals or entities, where neither p
Cornelius
In economics, the contract curve refers to the set of points in an Edgeworth box diagram where both parties involved in a trade cannot be made better off without making one of them worse off. It represents the Pareto efficient allocations of goods between two individuals or entities,
Cornelius
Suppose a consumer consuming two commodities X and Y has The following utility function u=X0.4 Y0.6. If the price of the X and Y are 2 and 3 respectively and income Constraint is birr 50. A,Calculate quantities of x and y which maximize utility. B,Calculate value of Lagrange multiplier. C,Calculate quantities of X and Y consumed with a given price. D,alculate optimum level of output .
Feyisa Reply
Answer
Feyisa
c
Jabir
Got questions? Join the online conversation and get instant answers!
Jobilize.com Reply

Get Jobilize Job Search Mobile App in your pocket Now!

Get it on Google Play Download on the App Store Now


Source:  OpenStax, Anatomy & Physiology. OpenStax CNX. Feb 04, 2016 Download for free at http://legacy.cnx.org/content/col11496/1.8
Google Play and the Google Play logo are trademarks of Google Inc.

Notification Switch

Would you like to follow the 'Anatomy & Physiology' conversation and receive update notifications?

Ask