<< Chapter < Page Chapter >> Page >

Using a regression line to make predictions

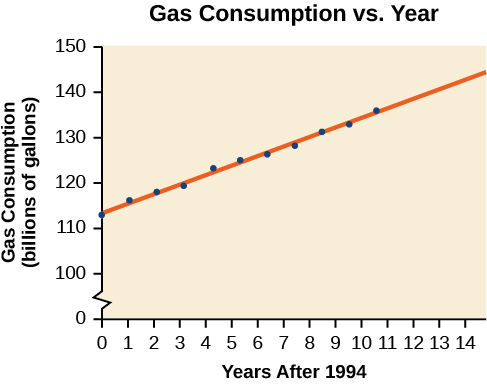
Gasoline consumption in the United States has been steadily increasing. Consumption data from 1994 to 2004 is shown in [link] . http://www.bts.gov/publications/national_transportation_statistics/2005/html/table_04_10.html Determine whether the trend is linear, and if so, find a model for the data. Use the model to predict the consumption in 2008.

Year '94 '95 '96 '97 '98 '99 '00 '01 '02 '03 '04
Consumption (billions of gallons) 113 116 118 119 123 125 126 128 131 133 136

The scatter plot of the data, including the least squares regression line, is shown in [link] .

Scatter plot, showing the line of best fit. It is titled 'Gas Consumption VS Year'. The x-axis is 'Year After 1994', and the y-axis is 'Gas Consumption (billions of gallons)'. The points are strongly positively correlated and the line of best fit goes through most of the points completely.

We can introduce new input variable, t , representing years since 1994.

The least squares regression equation is:

C ( t ) = 113.318 + 2.209 t

Using technology, the correlation coefficient was calculated to be 0.9965, suggesting a very strong increasing linear trend.

Using this to predict consumption in 2008 ( t = 14 ) ,

C ( 14 ) = 113.318 + 2.209 ( 14 )           = 144.244

The model predicts 144.244 billion gallons of gasoline consumption in 2008.

Got questions? Get instant answers now!

Use the model we created using technology in [link] to predict the gas consumption in 2011. Is this an interpolation or an extrapolation?

150.871 billion gallons; extrapolation

Got questions? Get instant answers now!

Access these online resources for additional instruction and practice with fitting linear models to data.

Key concepts

  • Scatter plots show the relationship between two sets of data. See [link] .
  • Scatter plots may represent linear or non-linear models.
  • The line of best fit may be estimated or calculated, using a calculator or statistical software. See [link] .
  • Interpolation can be used to predict values inside the domain and range of the data, whereas extrapolation can be used to predict values outside the domain and range of the data. See [link] .
  • The correlation coefficient, r , indicates the degree of linear relationship between data. See [link] .
  • A regression line best fits the data. See [link] .
  • The least squares regression line is found by minimizing the squares of the distances of points from a line passing through the data and may be used to make predictions regarding either of the variables. See [link] .

Section exercises

Verbal

Describe what it means if there is a model breakdown when using a linear model.

When our model no longer applies, after some value in the domain, the model itself doesn’t hold.

Got questions? Get instant answers now!

What is interpolation when using a linear model?

Got questions? Get instant answers now!

What is extrapolation when using a linear model?

We predict a value outside the domain and range of the data.

Got questions? Get instant answers now!

Explain the difference between a positive and a negative correlation coefficient.

Got questions? Get instant answers now!

Explain how to interpret the absolute value of a correlation coefficient.

The closer the number is to 1, the less scattered the data, the closer the number is to 0, the more scattered the data.

Got questions? Get instant answers now!

Algebraic

A regression was run to determine whether there is a relationship between hours of TV watched per day ( x ) and number of sit-ups a person can do ( y ) . The results of the regression are given below. Use this to predict the number of sit-ups a person who watches 11 hours of TV can do.

y = a x + b a = −1.341 b = 32.234   r = −0.896
Got questions? Get instant answers now!

Questions & Answers

how do you get the 2/50
Abba Reply
number of sport play by 50 student construct discrete data
Aminu Reply
width of the frangebany leaves on how to write a introduction
Theresa Reply
Solve the mean of variance
Veronica Reply
Step 1: Find the mean. To find the mean, add up all the scores, then divide them by the number of scores. ... Step 2: Find each score's deviation from the mean. ... Step 3: Square each deviation from the mean. ... Step 4: Find the sum of squares. ... Step 5: Divide the sum of squares by n – 1 or N.
kenneth
what is error
Yakuba Reply
Is mistake done to something
Vutshila
Hy
anas
hy
What is the life teble
anas
hy
Jibrin
statistics is the analyzing of data
Tajudeen Reply
what is statics?
Zelalem Reply
how do you calculate mean
Gloria Reply
diveving the sum if all values
Shaynaynay
let A1,A2 and A3 events be independent,show that (A1)^c, (A2)^c and (A3)^c are independent?
Fisaye Reply
what is statistics
Akhisani Reply
data collected all over the world
Shaynaynay
construct a less than and more than table
Imad Reply
The sample of 16 students is taken. The average age in the sample was 22 years with astandard deviation of 6 years. Construct a 95% confidence interval for the age of the population.
Aschalew Reply
Bhartdarshan' is an internet-based travel agency wherein customer can see videos of the cities they plant to visit. The number of hits daily is a normally distributed random variable with a mean of 10,000 and a standard deviation of 2,400 a. what is the probability of getting more than 12,000 hits? b. what is the probability of getting fewer than 9,000 hits?
Akshay Reply
Bhartdarshan'is an internet-based travel agency wherein customer can see videos of the cities they plan to visit. The number of hits daily is a normally distributed random variable with a mean of 10,000 and a standard deviation of 2,400. a. What is the probability of getting more than 12,000 hits
Akshay
1
Bright
Sorry i want to learn more about this question
Bright
Someone help
Bright
a= 0.20233 b=0.3384
Sufiyan
a
Shaynaynay
How do I interpret level of significance?
Mohd Reply
It depends on your business problem or in Machine Learning you could use ROC- AUC cruve to decide the threshold value
Shivam
how skewness and kurtosis are used in statistics
Owen Reply
yes what is it
Taneeya
Got questions? Join the online conversation and get instant answers!
Jobilize.com Reply
Practice Key Terms 5

Get Jobilize Job Search Mobile App in your pocket Now!

Get it on Google Play Download on the App Store Now


Source:  OpenStax, College algebra. OpenStax CNX. Feb 06, 2015 Download for free at https://legacy.cnx.org/content/col11759/1.3
Google Play and the Google Play logo are trademarks of Google Inc.

Notification Switch

Would you like to follow the 'College algebra' conversation and receive update notifications?

Ask