When the endpoints of a line segment are known, we can find the point midway between them. This point is known as the midpoint and the formula is known as the
midpoint formula . Given the endpoints of a line segment,
and
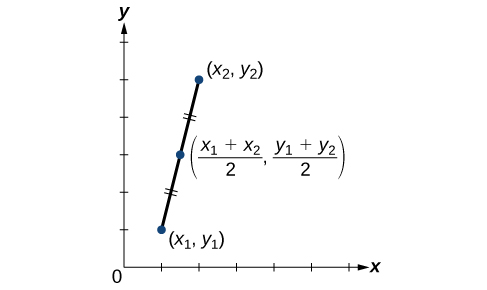
the midpoint formula states how to find the coordinates of the midpoint
A graphical view of a midpoint is shown in
[link] . Notice that the line segments on either side of the midpoint are congruent.
Finding the midpoint of the line segment
Find the midpoint of the line segment with the endpoints
and
Use the formula to find the midpoint of the line segment.
We can locate, or plot, points in the Cartesian coordinate system using ordered pairs, which are defined as displacement from the
x- axis and displacement from the
y- axis. See
[link] .
An equation can be graphed in the plane by creating a table of values and plotting points. See
[link].
Using a graphing calculator or a computer program makes graphing equations faster and more accurate. Equations usually have to be entered in the form
y= _____. See
[link].
Finding the
x- and
y- intercepts can define the graph of a line. These are the points where the graph crosses the axes. See
[link] .
The distance formula is derived from the Pythagorean Theorem and is used to find the length of a line segment. See
[link] and
[link] .
The midpoint formula provides a method of finding the coordinates of the midpoint dividing the sum of the
x -coordinates and the sum of the
y -coordinates of the endpoints by 2. See
[link] and
[link] .
Section exercises
Verbal
Is it possible for a point plotted in the Cartesian coordinate system to not lie in one of the four quadrants? Explain.
Answers may vary. Yes. It is possible for a point to be on the
x -axis or on the
y -axis and therefore is considered to NOT be in one of the quadrants.
In economics, a perfect market refers to a theoretical construct where all participants have perfect information, goods are homogenous, there are no barriers to entry or exit, and prices are determined solely by supply and demand. It's an idealized model used for analysis,
When MP₁ becomes negative, TP start to decline.
Extuples Suppose that the short-run production function of certain cut-flower firm is given by: Q=4KL-0.6K2 - 0.112 •
Where is quantity of cut flower produced, I is labour input and K is fixed capital input (K-5). Determine the average product of lab
Kelo
Extuples Suppose that the short-run production function of certain cut-flower firm is given by: Q=4KL-0.6K2 - 0.112 •
Where is quantity of cut flower produced, I is labour input and K is fixed capital input (K-5). Determine the average product of labour (APL) and marginal product of labour (MPL)
Quantity demanded refers to the specific amount of a good or service that consumers are willing and able to purchase at a give price and within a specific time period. Demand, on the other hand, is a broader concept that encompasses the entire relationship between price and quantity demanded
Ezea
ok
Shukri
how do you save a country economic situation when it's falling apart
Economic growth as an increase in the production and consumption of goods and services within an economy.but
Economic development as a broader concept that encompasses not only economic growth but also social & human well being.
Shukri
production function means
Jabir
What do you think is more important to focus on when considering inequality ?
sir...I just want to ask one question... Define the term contract curve? if you are free please help me to find this answer 🙏
Asui
it is a curve that we get after connecting the pareto optimal combinations of two consumers after their mutually beneficial trade offs
Awais
thank you so much 👍 sir
Asui
In economics, the contract curve refers to the set of points in an Edgeworth box diagram where both parties involved in a trade cannot be made better off without making one of them worse off. It represents the Pareto efficient allocations of goods between two individuals or entities, where neither p
Cornelius
In economics, the contract curve refers to the set of points in an Edgeworth box diagram where both parties involved in a trade cannot be made better off without making one of them worse off. It represents the Pareto efficient allocations of goods between two individuals or entities,
Cornelius
Suppose a consumer consuming two commodities X and Y has
The following utility function u=X0.4 Y0.6. If the price of the X and Y are 2 and 3 respectively and income Constraint is birr 50.
A,Calculate quantities of x and y which maximize utility.
B,Calculate value of Lagrange multiplier.
C,Calculate quantities of X and Y consumed with a given price.
D,alculate optimum level of output .