<< Chapter < Page Chapter >> Page >
This module describes how to graph basic functions.

Graphing, like algebraic generalizations, is a difficult topic because many students know how to do it but are not sure what it means .

For instance, consider the following graph:
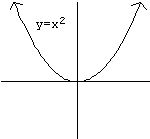
A parabola showing the graph of y=x-squared

If I asked you “Draw the graph of y = x 2 size 12{y=x rSup { size 8{2} } } {} ” you would probably remember how to plot points and draw the shape.

But suppose I asked you this instead: “Here’s a function, y = x 2 size 12{y=x rSup { size 8{2} } } {} . And here’s a shape, that sort of looks like a U. What do they actually have to do with each other?” This is a harder question! What does it mean to graph a function?

The answer is simple, but it has important implications for a proper understanding of functions. Recall that every point on the plane is designated by a unique ( x , y ) size 12{ \( x,y \) } {} pair of coordinates: for instance, one point is ( 5,3 ) size 12{ \( 5,3 \) } {} . We say that its x size 12{x} {} -value is 5 and its y size 12{y} {} -value is 3.

A few of these points have the particular property that their y size 12{y} {} -values are the square of their x size 12{x} {} -values. For instance, the points ( 0,0 ) size 12{ \( 0,0 \) } {} , ( 3,9 ) size 12{ \( 3,9 \) } {} , and ( 5, 25 ) size 12{ \( - 5, 25 \) } {} all have that property. ( 5,3 ) size 12{ \( 5,3 \) } {} and ( 2, 4 ) size 12{ \( - 2, - 4 \) } {} do not.

The graph shown—the pseudo-U shape—is all the points in the plane that have this property . Any point whose y size 12{x} {} -value is the square of its x size 12{x} {} -value is on this shape; any point whose y size 12{y} {} -value is not the square of its x size 12{x} {} -value is not on this shape. Hence, glancing at this shape gives us a complete visual picture of the function y = x 2 size 12{y=x rSup { size 8{2} } } {} if we know how to interpret it correctly .

Graphing functions

Remember that every function specifies a relationship between two variables. When we graph a function, we put the independent variable on the x size 12{x} {} -axis, and the dependent variable on the y size 12{y} {} -axis.

For instance, recall the function that describes Alice’s money as a function of her hours worked. Since Alice makes $12/hour, her financial function is m ( t ) = 12 t size 12{m \( t \) ="12"t} {} . We can graph it like this.

a graph depicting the function of Alice's pay.

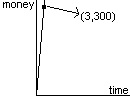
This simple graph has a great deal to tell us about Alice’s job, if we read it correctly.

  • The graph contains the point ( 3, 300 ) size 12{ \( 3,"300" \) } {} .What does that tell us? That after Alice has worked for three hours, she has made $300.
  • The graph goes through the origin (the point ( 0,0 ) size 12{ \( 0,0 \) } {} ). What does that tell us? That when she works 0 hours, Alice makes no money.
  • The graph exists only in the first quadrant. What does that tell us? On the mathematical level, it indicates the domain of the function ( t 0 size 12{t>= 0} {} ) and the range of the function ( m 0 size 12{m>= 0} {} ). In terms of the situation, it tells us that Alice cannot work negative hours or make negative money.
  • The graph is a straight line. What does that tell us? That Alice makes the same amount of money every day: every day, her money goes up by $100. ($100/day is the slope of the line—more on this in the section on linear functions.)

Consider now the following, more complicated graph, which represents Alice’s hair length as a function of time (where time is now measured in weeks instead of hours).
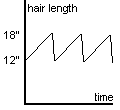
A right slanted saw-tooth graph oscillating between 12 and 18 inches.

What does this graph h ( t ) size 12{h \( t \) } {} tell us? We can start with the same sort of simple analysis.

  • The graph goes through the point ( 0, 12 ) size 12{ \( 0,"12" \) } {} .This tells us that at time ( t = 0 ) size 12{ \( t=0 \) } {} , Alice’s hair is 12" long.
  • The range of this graph appears to be 12 h 18 size 12{"12"<= h<= "18"} {} . Alice never allows her hair to be shorter than 12" or longer than 18".

Questions & Answers

What is inflation
Bright Reply
a general and ongoing rise in the level of prices in an economy
AI-Robot
What are the factors that affect demand for a commodity
Florence Reply
price
Kenu
differentiate between demand and supply giving examples
Lambiv Reply
differentiated between demand and supply using examples
Lambiv
what is labour ?
Lambiv
how will I do?
Venny Reply
how is the graph works?I don't fully understand
Rezat Reply
information
Eliyee
devaluation
Eliyee
t
WARKISA
hi guys good evening to all
Lambiv
multiple choice question
Aster Reply
appreciation
Eliyee
explain perfect market
Lindiwe Reply
In economics, a perfect market refers to a theoretical construct where all participants have perfect information, goods are homogenous, there are no barriers to entry or exit, and prices are determined solely by supply and demand. It's an idealized model used for analysis,
Ezea
What is ceteris paribus?
Shukri Reply
other things being equal
AI-Robot
When MP₁ becomes negative, TP start to decline. Extuples Suppose that the short-run production function of certain cut-flower firm is given by: Q=4KL-0.6K2 - 0.112 • Where is quantity of cut flower produced, I is labour input and K is fixed capital input (K-5). Determine the average product of lab
Kelo
Extuples Suppose that the short-run production function of certain cut-flower firm is given by: Q=4KL-0.6K2 - 0.112 • Where is quantity of cut flower produced, I is labour input and K is fixed capital input (K-5). Determine the average product of labour (APL) and marginal product of labour (MPL)
Kelo
yes,thank you
Shukri
Can I ask you other question?
Shukri
what is monopoly mean?
Habtamu Reply
What is different between quantity demand and demand?
Shukri Reply
Quantity demanded refers to the specific amount of a good or service that consumers are willing and able to purchase at a give price and within a specific time period. Demand, on the other hand, is a broader concept that encompasses the entire relationship between price and quantity demanded
Ezea
ok
Shukri
how do you save a country economic situation when it's falling apart
Lilia Reply
what is the difference between economic growth and development
Fiker Reply
Economic growth as an increase in the production and consumption of goods and services within an economy.but Economic development as a broader concept that encompasses not only economic growth but also social & human well being.
Shukri
production function means
Jabir
What do you think is more important to focus on when considering inequality ?
Abdisa Reply
any question about economics?
Awais Reply
sir...I just want to ask one question... Define the term contract curve? if you are free please help me to find this answer 🙏
Asui
it is a curve that we get after connecting the pareto optimal combinations of two consumers after their mutually beneficial trade offs
Awais
thank you so much 👍 sir
Asui
In economics, the contract curve refers to the set of points in an Edgeworth box diagram where both parties involved in a trade cannot be made better off without making one of them worse off. It represents the Pareto efficient allocations of goods between two individuals or entities, where neither p
Cornelius
In economics, the contract curve refers to the set of points in an Edgeworth box diagram where both parties involved in a trade cannot be made better off without making one of them worse off. It represents the Pareto efficient allocations of goods between two individuals or entities,
Cornelius
Suppose a consumer consuming two commodities X and Y has The following utility function u=X0.4 Y0.6. If the price of the X and Y are 2 and 3 respectively and income Constraint is birr 50. A,Calculate quantities of x and y which maximize utility. B,Calculate value of Lagrange multiplier. C,Calculate quantities of X and Y consumed with a given price. D,alculate optimum level of output .
Feyisa Reply
Answer
Feyisa
c
Jabir
Got questions? Join the online conversation and get instant answers!
Jobilize.com Reply

Get Jobilize Job Search Mobile App in your pocket Now!

Get it on Google Play Download on the App Store Now


Source:  OpenStax, Math 1508 (lecture) readings in precalculus. OpenStax CNX. Aug 24, 2011 Download for free at http://cnx.org/content/col11354/1.1
Google Play and the Google Play logo are trademarks of Google Inc.

Notification Switch

Would you like to follow the 'Math 1508 (lecture) readings in precalculus' conversation and receive update notifications?

Ask