<< Chapter < Page Chapter >> Page >

But what about the shape of the graph? The graph shows a gradual incline up to 18", and then a precipitous drop back down to 12"; and this pattern repeats throughout the shown time. The most likely explanation is that Alice’s hair grows slowly until it reaches 18", at which point she goes to the hair stylist and has it cut down, within a very short time (an hour or so), to 12". Then the gradual growth begins again.

The rule of consistency, graphically

Consider the following graph.
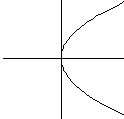
A horizontal parabola opening up to the right where x = y-squared.

This is our earlier “U” shaped graph ( y = x 2 size 12{y=x rSup { size 8{2} } } {} ) turned on its side. This might seem like a small change. But ask this question: what is y size 12{y} {} when x = 3 size 12{x=3} {} ? This question has two answers. This graph contains the points ( 3, 9 ) size 12{ \( 3, - 9 \) } {} and ( 3,9 ) size 12{ \( 3,9 \) } {} . So when x = 3 size 12{x=3} {} , y size 12{y} {} is both 9 and –9 on this graph.

This violates the only restriction on functions—the rule of consistency . Remember that the x size 12{x} {} -axis is the independent variable, the y size 12{y} {} -axis the dependent. In this case, one “input” value ( 3 ) size 12{ \( 3 \) } {} is leading to two different “output” values ( 9,9 ) size 12{ \( - 9,9 \) } {} We can therefore conclude that this graph does not represent a function at all. No function, no matter how simple or complicated, could produce this graph.

This idea leads us to the “vertical line test,” the graphical analog of the rule of consistency.

The Vertical Line Test
If you can draw any vertical line that touches a graph in two places, then that graph violates the rule of consistency and therefore does not represent any function.

It is important to understand that the vertical line test is not a new rule! It is the graphical version of the rule of consistency. If any vertical line touches a graph in two places, then the graph has two different y size 12{y} {} -values for the same x size 12{y} {} -value, and this is the only thing that functions are not allowed to do.

What happens to the graph, when you add 2 to a function?

Suppose the following is the graph of the function y = f ( x ) size 12{y=f \( x \) } {} .

The sum of tow graphs. Likely a parabola and line.
y = f ( x ) size 12{y=f \( x \) } {} ; Contains the following points (among others): ( 3,2 ) size 12{ \( - 3,2 \) } {} , ( 1, 3 ) size 12{ \( - 1, - 3 \) } {} , ( 1,2 ) size 12{ \( 1,2 \) } {} , ( 6,0 ) size 12{ \( 6,0 \) } {}

We can see from the graph that the domain of the graph is 3 x 6 size 12{ - 3<= x<= 6} {} and the range is 3 y 2 size 12{ - 3<= y<= 2} {} .

Question: What does the graph of y = f ( x ) + 2 size 12{y=f \( x \) +2} {} look like ?

This might seem an impossible question, since we do not even know what the function f ( x ) size 12{f \( x \) } {} is. But we don’t need to know that in order to plot a few points.

x size 12{x} {} f ( x ) size 12{f \( x \) } {} f ( x + 2 ) size 12{f \( x+2 \) } {} so y = f ( x ) size 12{y=f \( x \) } {} contains this point and y = f ( x ) + 2 size 12{y=f \( x \) +2} {} contains this point
–3 2 4 ( 3,2 ) size 12{ \( - 3,2 \) } {} ( 3,4 ) size 12{ \( - 3,4 \) } {}
–1 –3 –1 ( 1, 3 ) size 12{ \( - 1, - 3 \) } {} ( 1, 1 ) size 12{ \( - 1, - 1 \) } {}
1 2 4 ( 1,2 ) size 12{ \( 1,2 \) } {} ( 1,4 ) size 12{ \( 1,4 \) } {}
6 0 2 ( 6,0 ) size 12{ \( 6,0 \) } {} ( 6,2 ) size 12{ \( 6,2 \) } {}

If you plot these points on a graph, the pattern should become clear. Each point on the graph is moving up by two . This comes as no surprise: since you added 2 to each y-value, and adding 2 to a y-value moves any point up by 2. So the new graph will look identical to the old, only moved up by 2.

The sum of two functions. Likely a parabola and line.
y = f ( x ) size 12{y=f \( x \) } {}
The same graph as above shifted two places in the positive-y direction.
y = f ( x ) + 2 size 12{y=f \( x \) +2} {} ; All y size 12{y} {} -values are 2 higher

In a similar way, it should be obvious that if you subtract 10 from a function, the graph moves down by 10. Note that, in either case, the domain of the function is the same, but the range has changed.

These permutations work for any function . Hence, given the graph of the function y = x size 12{y= sqrt {x} } {} below (which you could generate by plotting points), you can produce the other two graphs without plotting points, simply by moving the first graph up and down.

Questions & Answers

What is inflation
Bright Reply
a general and ongoing rise in the level of prices in an economy
AI-Robot
What are the factors that affect demand for a commodity
Florence Reply
price
Kenu
differentiate between demand and supply giving examples
Lambiv Reply
differentiated between demand and supply using examples
Lambiv
what is labour ?
Lambiv
how will I do?
Venny Reply
how is the graph works?I don't fully understand
Rezat Reply
information
Eliyee
devaluation
Eliyee
t
WARKISA
hi guys good evening to all
Lambiv
multiple choice question
Aster Reply
appreciation
Eliyee
explain perfect market
Lindiwe Reply
In economics, a perfect market refers to a theoretical construct where all participants have perfect information, goods are homogenous, there are no barriers to entry or exit, and prices are determined solely by supply and demand. It's an idealized model used for analysis,
Ezea
What is ceteris paribus?
Shukri Reply
other things being equal
AI-Robot
When MP₁ becomes negative, TP start to decline. Extuples Suppose that the short-run production function of certain cut-flower firm is given by: Q=4KL-0.6K2 - 0.112 • Where is quantity of cut flower produced, I is labour input and K is fixed capital input (K-5). Determine the average product of lab
Kelo
Extuples Suppose that the short-run production function of certain cut-flower firm is given by: Q=4KL-0.6K2 - 0.112 • Where is quantity of cut flower produced, I is labour input and K is fixed capital input (K-5). Determine the average product of labour (APL) and marginal product of labour (MPL)
Kelo
yes,thank you
Shukri
Can I ask you other question?
Shukri
what is monopoly mean?
Habtamu Reply
What is different between quantity demand and demand?
Shukri Reply
Quantity demanded refers to the specific amount of a good or service that consumers are willing and able to purchase at a give price and within a specific time period. Demand, on the other hand, is a broader concept that encompasses the entire relationship between price and quantity demanded
Ezea
ok
Shukri
how do you save a country economic situation when it's falling apart
Lilia Reply
what is the difference between economic growth and development
Fiker Reply
Economic growth as an increase in the production and consumption of goods and services within an economy.but Economic development as a broader concept that encompasses not only economic growth but also social & human well being.
Shukri
production function means
Jabir
What do you think is more important to focus on when considering inequality ?
Abdisa Reply
any question about economics?
Awais Reply
sir...I just want to ask one question... Define the term contract curve? if you are free please help me to find this answer 🙏
Asui
it is a curve that we get after connecting the pareto optimal combinations of two consumers after their mutually beneficial trade offs
Awais
thank you so much 👍 sir
Asui
In economics, the contract curve refers to the set of points in an Edgeworth box diagram where both parties involved in a trade cannot be made better off without making one of them worse off. It represents the Pareto efficient allocations of goods between two individuals or entities, where neither p
Cornelius
In economics, the contract curve refers to the set of points in an Edgeworth box diagram where both parties involved in a trade cannot be made better off without making one of them worse off. It represents the Pareto efficient allocations of goods between two individuals or entities,
Cornelius
Suppose a consumer consuming two commodities X and Y has The following utility function u=X0.4 Y0.6. If the price of the X and Y are 2 and 3 respectively and income Constraint is birr 50. A,Calculate quantities of x and y which maximize utility. B,Calculate value of Lagrange multiplier. C,Calculate quantities of X and Y consumed with a given price. D,alculate optimum level of output .
Feyisa Reply
Answer
Feyisa
c
Jabir
Got questions? Join the online conversation and get instant answers!
Jobilize.com Reply

Get Jobilize Job Search Mobile App in your pocket Now!

Get it on Google Play Download on the App Store Now


Source:  OpenStax, Math 1508 (lecture) readings in precalculus. OpenStax CNX. Aug 24, 2011 Download for free at http://cnx.org/content/col11354/1.1
Google Play and the Google Play logo are trademarks of Google Inc.

Notification Switch

Would you like to follow the 'Math 1508 (lecture) readings in precalculus' conversation and receive update notifications?

Ask