

| << Chapter < Page | Chapter >> Page > |
Hierdie afdeling beskryf die grafieke van trigonometriese funksies.
Volgooi die volgende tabel en gebruik jou sakrekenaar om die waardes te bereken. Stip dan die waardes met op die -as en op die -as. Rond die antwoorde af tot 1 desimale plek.
| 0 | 30 | 60 | 90 | 120 | 150 | ||
| 180 | 210 | 240 | 270 | 300 | 330 | 360 | |
 |
Laat ons terugkyk na ons waardes vir
| 0 | 1 | 0 |
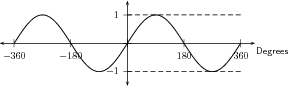
Soos jy kan sien, die funksie het 'n waarde van 0 by . Sy waarde neem egalig toe tot by wanneer sy waarde 1 is. Ons weet ook dat dit later afneem na 0 as . Deur dit alles bymekaar te sit, kan ons 'n idee kry van die volle omvang van die sinuskurwe. Die sinuskurwe word gewys in [link] . Let op die kurwe se vorm, waar elke kurwe die lengte het van . Ons sê die grafiek het 'n periode van . Die hoogte van die kurwe bo (of onder) die -as word die kurwe se amplitude genoem. Dus is die amplitude van die sinuskurwe is 1.
In die vergelyking, , en is konstantes en het verskillende invloede op die grafiek van die funksie. Die algemene vorm van hierdie grafiek word gewys in [link] vir die funksie .
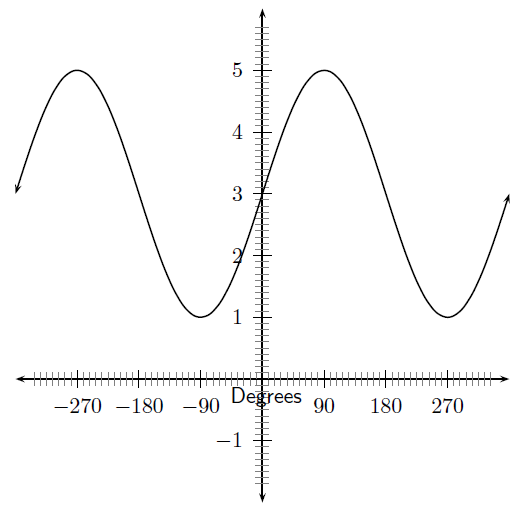
Dis duidelik dat 'n vertikale verskuiwing teweegbring. As , sal die hele sinusgrafiek 2 eenhede opskuif. As , suif die hele grafiek 1 eenheid af.
Hierdie eienskappe word opgesom in [link] .
Jy behoort te vind dat die waarde van die hoogte van die pieke van die grafiek beïnvloed. As die grootte van toeneem, word die pieke hoër. As dit afneem, word die pieke laer.
 |
 | |
 |
 |
Vir , is die gebied omdat daar geen waarde is van waarvoor ongedefinieerd is nie.
Die terrein van hang daarvan af of die waarde vir positief of negatief is. Ons sal die twee gevalle afsonderlik oorweeg.
As we have:
Dit vertel ons dat vir alle waardes van , altyd tussen en is. Daarom as , is die terrein van dus .
Insgelyks, daar kan getoon word dat as , dan is die terrein van is . Dit word as 'n oefening gelaat.
Die -snypunt, , van is eenvoudig die waarde van by .
Voltooi die volgende tabel, gebruik jou sakrekenaar om die waardes korrek tot 1 desimale plek te bereken. Stip dan die waardes met op die -as en op die -as.
Notification Switch
Would you like to follow the 'Siyavula textbooks: wiskunde (graad 10) [caps]' conversation and receive update notifications?

|
|

|
|

|
|

|
|

|
|
|
|
|
|
|
|

|
|

|
|

|