<< Chapter < Page Chapter >> Page >

Using the graphs of trigonometric functions to solve real-world problems

Many real-world scenarios represent periodic functions and may be modeled by trigonometric functions. As an example, let’s return to the scenario from the section opener. Have you ever observed the beam formed by the rotating light on a police car and wondered about the movement of the light beam itself across the wall? The periodic behavior of the distance the light shines as a function of time is obvious, but how do we determine the distance? We can use the tangent function .
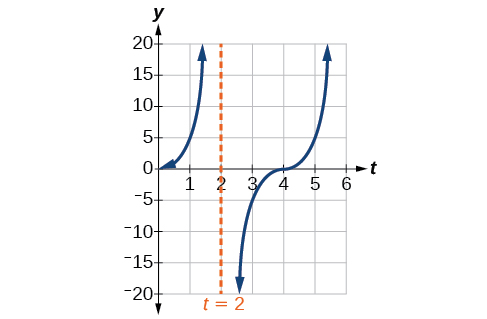
Using trigonometric functions to solve real-world scenarios

Suppose the function y = 5 tan ( π 4 t ) marks the distance in the movement of a light beam from the top of a police car across a wall where t is the time in seconds and y is the distance in feet from a point on the wall directly across from the police car.

  1. Find and interpret the stretching factor and period.
  2. Graph on the interval [ 0 , 5 ] .
  3. Evaluate f ( 1 ) and discuss the function’s value at that input.
  1. We know from the general form of y = A tan ( B t ) that | A | is the stretching factor and π B is the period.
    A graph showing that variable A is the coefficient of the tangent function and variable B is the coefficient of x, which is within that tangent function.

    We see that the stretching factor is 5. This means that the beam of light will have moved 5 ft after half the period.

    The period is π π 4 = π 1 4 π = 4. This means that every 4 seconds, the beam of light sweeps the wall. The distance from the spot across from the police car grows larger as the police car approaches.

  2. To graph the function, we draw an asymptote at t = 2 and use the stretching factor and period. See [link]
    A graph of one period of a modified tangent function, with a vertical asymptote at x=4.
  3. period: f ( 1 ) = 5 tan ( π 4 ( 1 ) ) = 5 ( 1 ) = 5 ; after 1 second, the beam of has moved 5 ft from the spot across from the police car.
Got questions? Get instant answers now!

Access these online resources for additional instruction and practice with graphs of other trigonometric functions.

Key equations

Shifted, compressed, and/or stretched tangent function y = A tan ( B x C ) + D
Shifted, compressed, and/or stretched secant function y = A sec ( B x C ) + D
Shifted, compressed, and/or stretched cosecant function y = A csc ( B x C ) + D
Shifted, compressed, and/or stretched cotangent function y = A cot ( B x C ) + D

Key concepts

  • The tangent function has period π .
  • f ( x ) = A tan ( B x C ) + D is a tangent with vertical and/or horizontal stretch/compression and shift. See [link] , [link] , and [link] .
  • The secant and cosecant are both periodic functions with a period of 2 π . f ( x ) = A sec ( B x C ) + D gives a shifted, compressed, and/or stretched secant function graph. See [link] and [link] .
  • f ( x ) = A csc ( B x C ) + D gives a shifted, compressed, and/or stretched cosecant function graph. See [link] and [link] .
  • The cotangent function has period π and vertical asymptotes at 0 , ± π , ± 2 π , ... .
  • The range of cotangent is ( , ) , and the function is decreasing at each point in its range.
  • The cotangent is zero at ± π 2 , ± 3 π 2 , ... .
  • f ( x ) = A cot ( B x C ) + D is a cotangent with vertical and/or horizontal stretch/compression and shift. See [link] and [link] .
  • Real-world scenarios can be solved using graphs of trigonometric functions. See [link] .

Section exercises

Verbal

Explain how the graph of the sine function can be used to graph y = csc x .

Since y = csc x is the reciprocal function of y = sin x , you can plot the reciprocal of the coordinates on the graph of y = sin x to obtain the y -coordinates of y = csc x . The x -intercepts of the graph y = sin x are the vertical asymptotes for the graph of y = csc x .

Got questions? Get instant answers now!

Questions & Answers

how do you get the 2/50
Abba Reply
number of sport play by 50 student construct discrete data
Aminu Reply
width of the frangebany leaves on how to write a introduction
Theresa Reply
Solve the mean of variance
Veronica Reply
Step 1: Find the mean. To find the mean, add up all the scores, then divide them by the number of scores. ... Step 2: Find each score's deviation from the mean. ... Step 3: Square each deviation from the mean. ... Step 4: Find the sum of squares. ... Step 5: Divide the sum of squares by n – 1 or N.
kenneth
what is error
Yakuba Reply
Is mistake done to something
Vutshila
Hy
anas
hy
What is the life teble
anas
hy
Jibrin
statistics is the analyzing of data
Tajudeen Reply
what is statics?
Zelalem Reply
how do you calculate mean
Gloria Reply
diveving the sum if all values
Shaynaynay
let A1,A2 and A3 events be independent,show that (A1)^c, (A2)^c and (A3)^c are independent?
Fisaye Reply
what is statistics
Akhisani Reply
data collected all over the world
Shaynaynay
construct a less than and more than table
Imad Reply
The sample of 16 students is taken. The average age in the sample was 22 years with astandard deviation of 6 years. Construct a 95% confidence interval for the age of the population.
Aschalew Reply
Bhartdarshan' is an internet-based travel agency wherein customer can see videos of the cities they plant to visit. The number of hits daily is a normally distributed random variable with a mean of 10,000 and a standard deviation of 2,400 a. what is the probability of getting more than 12,000 hits? b. what is the probability of getting fewer than 9,000 hits?
Akshay Reply
Bhartdarshan'is an internet-based travel agency wherein customer can see videos of the cities they plan to visit. The number of hits daily is a normally distributed random variable with a mean of 10,000 and a standard deviation of 2,400. a. What is the probability of getting more than 12,000 hits
Akshay
1
Bright
Sorry i want to learn more about this question
Bright
Someone help
Bright
a= 0.20233 b=0.3384
Sufiyan
a
Shaynaynay
How do I interpret level of significance?
Mohd Reply
It depends on your business problem or in Machine Learning you could use ROC- AUC cruve to decide the threshold value
Shivam
how skewness and kurtosis are used in statistics
Owen Reply
yes what is it
Taneeya
Got questions? Join the online conversation and get instant answers!
Jobilize.com Reply

Get Jobilize Job Search Mobile App in your pocket Now!

Get it on Google Play Download on the App Store Now


Source:  OpenStax, Algebra and trigonometry. OpenStax CNX. Nov 14, 2016 Download for free at https://legacy.cnx.org/content/col11758/1.6
Google Play and the Google Play logo are trademarks of Google Inc.

Notification Switch

Would you like to follow the 'Algebra and trigonometry' conversation and receive update notifications?

Ask