<< Chapter < Page Chapter >> Page >

A regression was run to determine whether there is a relationship between the diameter of a tree ( x , in inches) and the tree’s age ( y , in years). The results of the regression are given below. Use this to predict the age of a tree with diameter 10 inches.

y = a x + b a = 6.301 b = −1.044   r = −0.970

61.966 years

Got questions? Get instant answers now!

For the following exercises, draw a scatter plot for the data provided. Does the data appear to be linearly related?

0 2 4 6 8 10
–22 –19 –15 –11 –6 –2
Got questions? Get instant answers now!
1 2 3 4 5 6
46 50 59 75 100 136
Scatter plot with a collection of points appearing at (1,46); (2,50); (3,59); (4,75); (5, 100); and (6,136); they do not appear linear

No.

Got questions? Get instant answers now!
100 250 300 450 600 750
12 12.6 13.1 14 14.5 15.2
Got questions? Get instant answers now!
1 3 5 7 9 11
1 9 28 65 125 216
Scatterplot with a collection of points at (1,1); (3,9); (5,28); (7,65); (9,125); and (11,216); they do not appear linear

No.

Got questions? Get instant answers now!

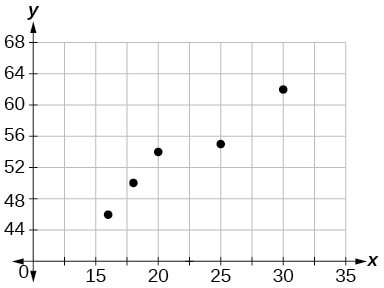
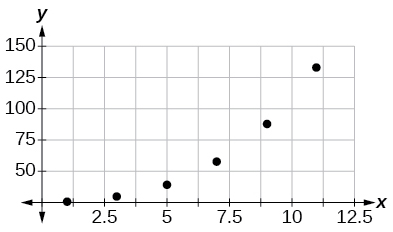
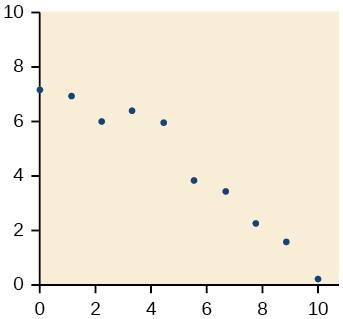
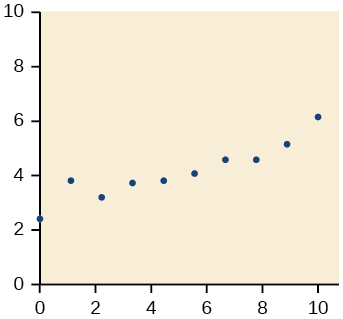
For the following data, draw a scatter plot. If we wanted to know when the population would reach 15,000, would the answer involve interpolation or extrapolation? Eyeball the line, and estimate the answer.

Year Population
1990 11,500
1995 12,100
2000 12,700
2005 13,000
2010 13,750
Got questions? Get instant answers now!

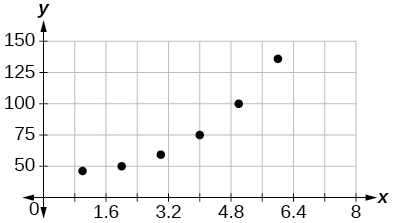
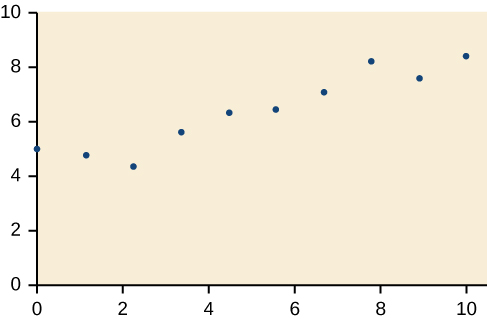
For the following data, draw a scatter plot. If we wanted to know when the temperature would reach 28°F, would the answer involve interpolation or extrapolation? Eyeball the line and estimate the answer.

Temperature,°F 16 18 20 25 30
Time, seconds 46 50 54 55 62
Scatterplot with a collection of points at (16,46); (18,50); (20,54); (25,55); and (30,62); they appear nonlinear

Interpolation. About 60 ° F .

Got questions? Get instant answers now!

Graphical

For the following exercises, match each scatterplot with one of the four specified correlations in [link] and [link] .

Side-by-side scatter plots.  The first is a scattered correlation in the positive direction.  The second is a scattered correlation in the negative direction
Side-by-side scatter plots.  The first has a strong negative correlation with all the points spaced out evenly near the top and center, but more spread out near the bottom.  The second has a strong positive correlation, with the points more spread out near the bottom and closer together near the center and top.

r = −0. 89

This value of r indicates a strong negative correlation or slope, so C

Got questions? Get instant answers now!

r = −0.39

This value of r indicates a weak negative correlation, so B

Got questions? Get instant answers now!

For the following exercises, draw a best-fit line for the plotted data.

Numeric

The U.S. Census tracks the percentage of persons 25 years or older who are college graduates. That data for several years is given in [link] . Based on data from http://www.census.gov/hhes/socdemo/education/data/cps/historical/index.html. Accessed 5/1/2014. Determine whether the trend appears linear. If so, and assuming the trend continues, in what year will the percentage exceed 35%?

Year Percent Graduates
1990 21.3
1992 21.4
1994 22.2
1996 23.6
1998 24.4
2000 25.6
2002 26.7
2004 27.7
2006 28
2008 29.4
Got questions? Get instant answers now!

The U.S. import of wine (in hectoliters) for several years is given in [link] . Determine whether the trend appears linear. If so, and assuming the trend continues, in what year will imports exceed 12,000 hectoliters?

Year Imports
1992 2665
1994 2688
1996 3565
1998 4129
2000 4584
2002 5655
2004 6549
2006 7950
2008 8487
2009 9462

Yes, trend appears linear because r = 0. 985 and will exceed 12,000 near midyear, 2016, 24.6 years since 1992.

Got questions? Get instant answers now!

[link] shows the year and the number of people unemployed in a particular city for several years. Determine whether the trend appears linear. If so, and assuming the trend continues, in what year will the number of unemployed reach 5?

Year Number Unemployed
1990 750
1992 670
1994 650
1996 605
1998 550
2000 510
2002 460
2004 420
2006 380
2008 320
Got questions? Get instant answers now!

Technology

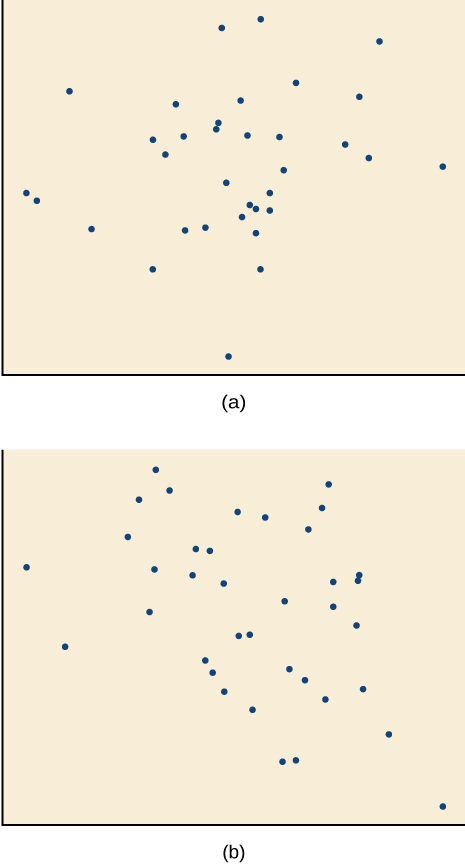
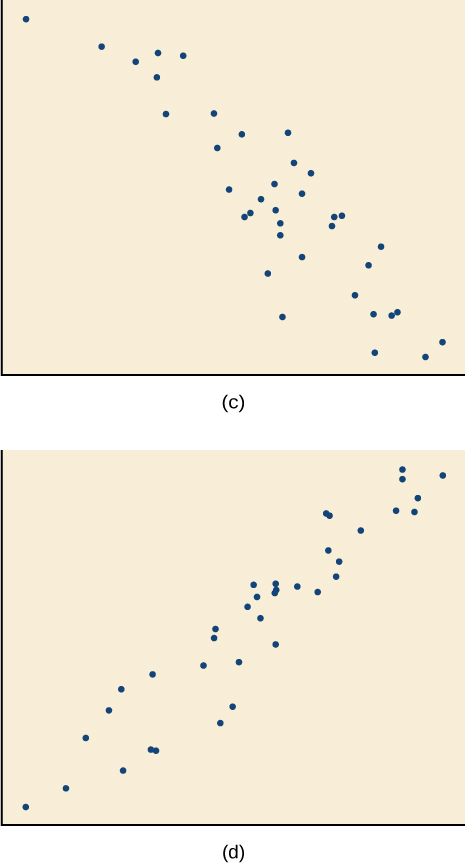
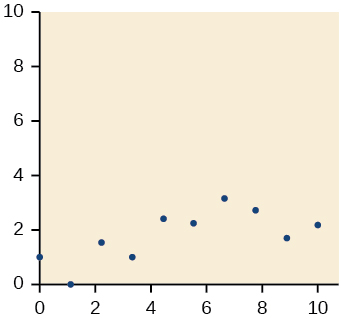
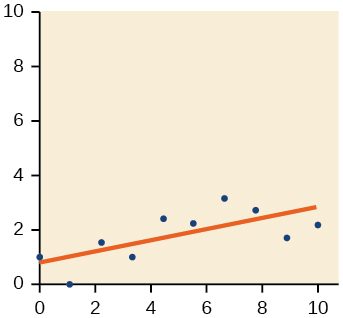
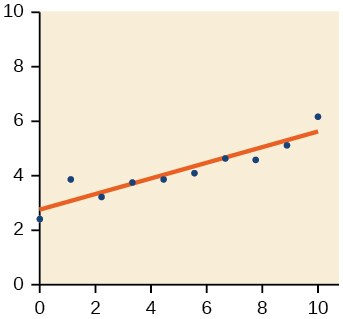
For the following exercises, use each set of data to calculate the regression line using a calculator or other technology tool, and determine the correlation coefficient to 3 decimal places of accuracy.

x 8 15 26 31 56
y 23 41 53 72 103

y = 1 . 64 0 x + 13 . 8 00 , r = 0. 987

Got questions? Get instant answers now!
x 5 7 10 12 15
y 4 12 17 22 24
Got questions? Get instant answers now!
x y x y
3 21.9 10 18.54
4 22.22 11 15.76
5 22.74 12 13.68
6 22.26 13 14.1
7 20.78 14 14.02
8 17.6 15 11.94
9 16.52 16 12.76

y = 0.962 x + 26.86 ,       r = 0.965

Got questions? Get instant answers now!

Questions & Answers

how does the planets on our solar system orbit
cheten Reply
how many Messier objects are there in space
satish Reply
did you g8ve certificate
Richard Reply
what are astronomy
Issan Reply
Astronomy (from Ancient Greek ἀστρονομία (astronomía) 'science that studies the laws of the stars') is a natural science that studies celestial objects and phenomena. It uses mathematics, physics, and chemistry in order to explain their origin and evolution.
Rafael
vjuvu
Elgoog
what is big bang theory?
Rosemary
what type of activity astronomer do?
Rosemary
No
Richard
the big bang theory is a theory which states that all matter was compressed together in one place the matter got so unstable it exploded releasing All its contents in the form of hydrogen
Roaul
I want to be an astronomer. That's my dream
Astrit
Who named the the whole galaxy?
Shola Reply
solar Univers
GPOWER
what is space
Richard
what is the dark matter
Richard
what are the factors upon which the atmosphere is stratified
Nicholas Reply
is the big bang the sun
Folakemi Reply
no
Sokak
bigbang is the beginning of the universe
Sokak
but thats just a theory
Sokak
nothing will happen, don't worry brother.
Vansh
what does comet means
GANGAIN Reply
these are Rocky substances between mars and jupiter
GANGAIN
Comets are cosmic snowballs of frozen gases , rock and dust that orbit the sun. They are mostly found between the orbits of Venus and Mercury.
Aarya
hllo
John
hi
John
qt rrt
John
r u there
John
hey can anyone guide me abt international astronomy olympiad
sahil
how can we learn right and true ?
Govinda Reply
why the moon is always appear in an elliptical shape
Gatjuol Reply
Because when astroid hit the Earth then a piece of elliptical shape of the earth was separated which is now called moon.
Hemen
what's see level?
lidiya Reply
Did you mean eye sight or sea level
Minal
oh sorry it's sea level
lidiya
according to the theory of astronomers why the moon is always appear in an elliptical orbit?
Gatjuol
hi !!! I am new in astronomy.... I have so many questions in mind .... all of scientists of the word they just give opinion only. but they never think true or false ... i respect all of them... I believes whole universe depending on true ...থিউরি
Govinda
hello
Jackson
hi
Elyana
we're all stars and galaxies a part of sun. how can science prove thx with respect old ancient times picture or books..or anything with respect to present time .but we r a part of that universe
w astronomy and cosmology!
Michele
another theory of universe except big ban
Albash Reply
how was universe born
Asmit Reply
there many theory to born universe but what is the reality of big bang theory to born universe
Asmit
what is the exact value of π?
Nagalakshmi
by big bang
universal
there are many theories regarding this it's on you believe any theory that you think is true ex. eternal inflation theory, oscillation model theory, multiple universe theory the big bang theory etc.
Aarya
I think after Big Bang!
Michele
from where on earth could u observe all the stars during the during the course of an year
Karuna Reply
I think it couldn't possible on earth
Nagalakshmi
in this time i don't Know
Michele
is that so. the question was in the end of this chapter
Karuna
in theory, you could see them all from the equator (though over the course of a year, not at pne time). stars are measured in "declination", which is how far N or S of the equator (90* to -90*). Polaris is the North star, and is ALMOST 90* (+89*). So it would just barely creep over the horizon.
Christopher
Got questions? Join the online conversation and get instant answers!
Jobilize.com Reply
Practice Key Terms 5

Get Jobilize Job Search Mobile App in your pocket Now!

Get it on Google Play Download on the App Store Now


Source:  OpenStax, Algebra and trigonometry. OpenStax CNX. Nov 14, 2016 Download for free at https://legacy.cnx.org/content/col11758/1.6
Google Play and the Google Play logo are trademarks of Google Inc.

Notification Switch

Would you like to follow the 'Algebra and trigonometry' conversation and receive update notifications?

Ask