<< Chapter < Page Chapter >> Page >

A regression was run to determine whether there is a relationship between the diameter of a tree ( x , in inches) and the tree’s age ( y , in years). The results of the regression are given below. Use this to predict the age of a tree with diameter 10 inches.

y = a x + b a = 6.301 b = −1.044   r = −0.970

61.966 years

Got questions? Get instant answers now!

For the following exercises, draw a scatter plot for the data provided. Does the data appear to be linearly related?

0 2 4 6 8 10
–22 –19 –15 –11 –6 –2
Got questions? Get instant answers now!
1 2 3 4 5 6
46 50 59 75 100 136
Scatter plot with a collection of points appearing at (1,46); (2,50); (3,59); (4,75); (5, 100); and (6,136); they do not appear linear

No.

Got questions? Get instant answers now!
100 250 300 450 600 750
12 12.6 13.1 14 14.5 15.2
Got questions? Get instant answers now!
1 3 5 7 9 11
1 9 28 65 125 216
Scatterplot with a collection of points at (1,1); (3,9); (5,28); (7,65); (9,125); and (11,216); they do not appear linear

No.

Got questions? Get instant answers now!

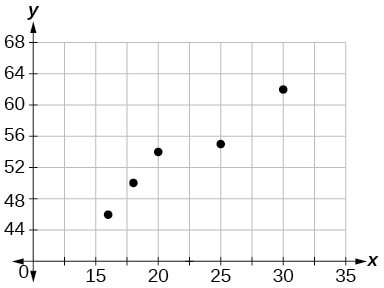
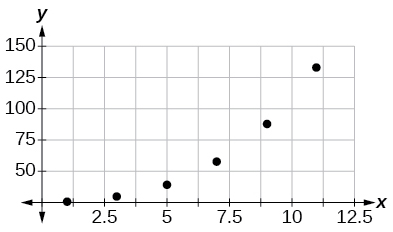
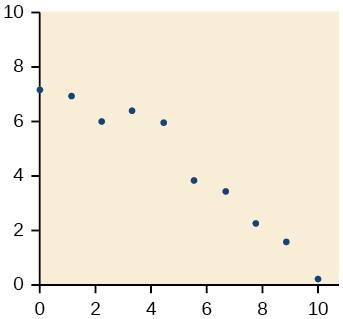
For the following data, draw a scatter plot. If we wanted to know when the population would reach 15,000, would the answer involve interpolation or extrapolation? Eyeball the line, and estimate the answer.

Year Population
1990 11,500
1995 12,100
2000 12,700
2005 13,000
2010 13,750
Got questions? Get instant answers now!

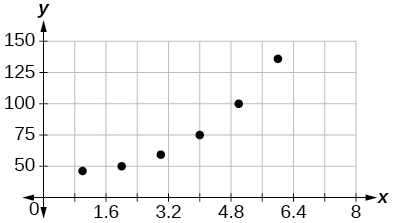
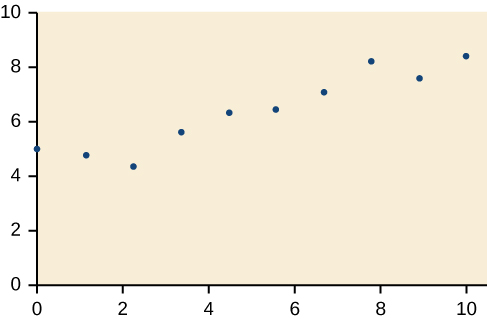
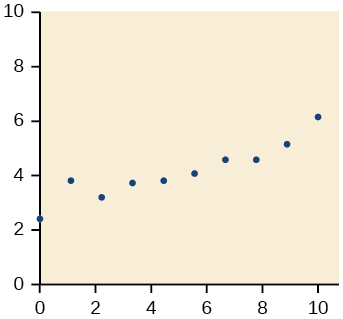
For the following data, draw a scatter plot. If we wanted to know when the temperature would reach 28°F, would the answer involve interpolation or extrapolation? Eyeball the line and estimate the answer.

Temperature,°F 16 18 20 25 30
Time, seconds 46 50 54 55 62
Scatterplot with a collection of points at (16,46); (18,50); (20,54); (25,55); and (30,62); they appear nonlinear

Interpolation. About 60 ° F .

Got questions? Get instant answers now!

Graphical

For the following exercises, match each scatterplot with one of the four specified correlations in [link] and [link] .

Side-by-side scatter plots.  The first is a scattered correlation in the positive direction.  The second is a scattered correlation in the negative direction
Side-by-side scatter plots.  The first has a strong negative correlation with all the points spaced out evenly near the top and center, but more spread out near the bottom.  The second has a strong positive correlation, with the points more spread out near the bottom and closer together near the center and top.

r = −0. 89

This value of r indicates a strong negative correlation or slope, so C

Got questions? Get instant answers now!

r = −0.39

This value of r indicates a weak negative correlation, so B

Got questions? Get instant answers now!

For the following exercises, draw a best-fit line for the plotted data.

Numeric

The U.S. Census tracks the percentage of persons 25 years or older who are college graduates. That data for several years is given in [link] . Based on data from http://www.census.gov/hhes/socdemo/education/data/cps/historical/index.html. Accessed 5/1/2014. Determine whether the trend appears linear. If so, and assuming the trend continues, in what year will the percentage exceed 35%?

Year Percent Graduates
1990 21.3
1992 21.4
1994 22.2
1996 23.6
1998 24.4
2000 25.6
2002 26.7
2004 27.7
2006 28
2008 29.4
Got questions? Get instant answers now!

The U.S. import of wine (in hectoliters) for several years is given in [link] . Determine whether the trend appears linear. If so, and assuming the trend continues, in what year will imports exceed 12,000 hectoliters?

Year Imports
1992 2665
1994 2688
1996 3565
1998 4129
2000 4584
2002 5655
2004 6549
2006 7950
2008 8487
2009 9462

Yes, trend appears linear because r = 0. 985 and will exceed 12,000 near midyear, 2016, 24.6 years since 1992.

Got questions? Get instant answers now!

[link] shows the year and the number of people unemployed in a particular city for several years. Determine whether the trend appears linear. If so, and assuming the trend continues, in what year will the number of unemployed reach 5?

Year Number Unemployed
1990 750
1992 670
1994 650
1996 605
1998 550
2000 510
2002 460
2004 420
2006 380
2008 320
Got questions? Get instant answers now!

Technology

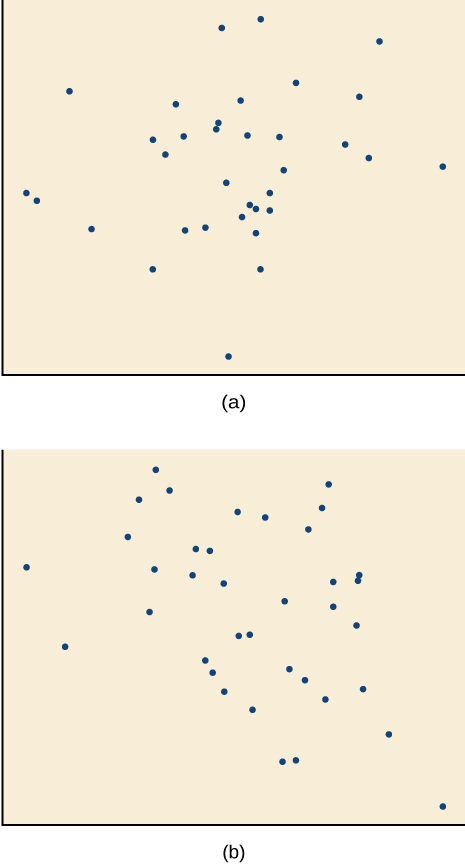
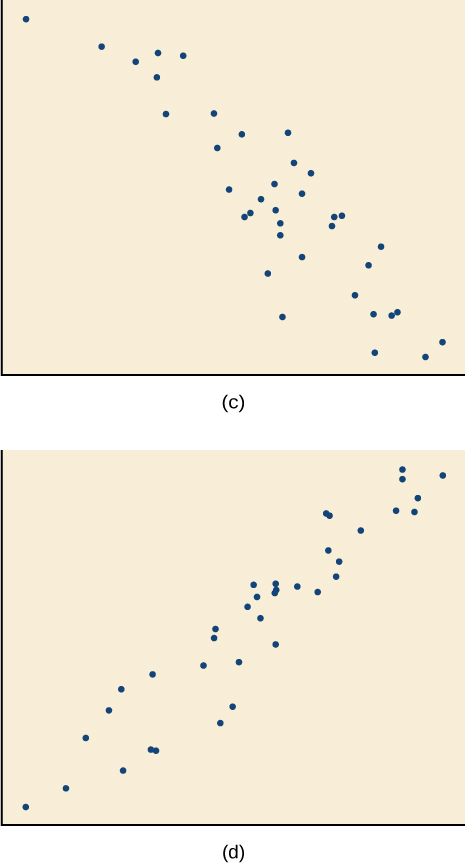
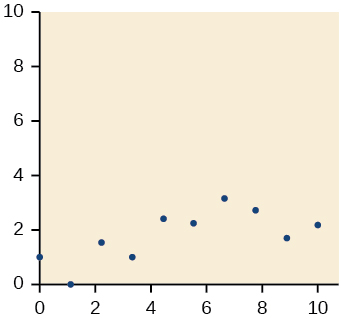
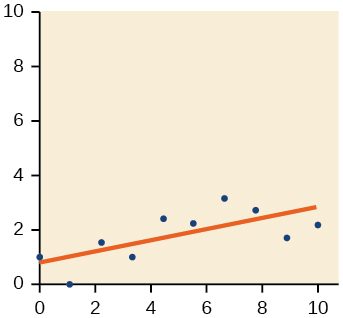
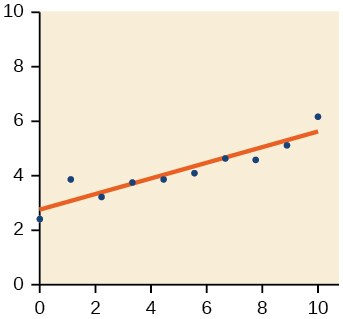
For the following exercises, use each set of data to calculate the regression line using a calculator or other technology tool, and determine the correlation coefficient to 3 decimal places of accuracy.

x 8 15 26 31 56
y 23 41 53 72 103

y = 1 . 64 0 x + 13 . 8 00 , r = 0. 987

Got questions? Get instant answers now!
x 5 7 10 12 15
y 4 12 17 22 24
Got questions? Get instant answers now!
x y x y
3 21.9 10 18.54
4 22.22 11 15.76
5 22.74 12 13.68
6 22.26 13 14.1
7 20.78 14 14.02
8 17.6 15 11.94
9 16.52 16 12.76

y = 0.962 x + 26.86 ,       r = 0.965

Got questions? Get instant answers now!

Questions & Answers

it is the relatively stable flow of income
Chidubem Reply
what is circular flow of income
Divine Reply
branches of macroeconomics
SHEDRACK Reply
what is Flexible exchang rate?
poudel Reply
is gdp a reliable measurement of wealth
Atega Reply
introduction to econometrics
Husseini Reply
Hi
mostafa
hi
LEMLEM
hello
Sammol
hi
Mahesh
bi
Ruqayat
hi
Ruqayat
Hi fellas
Nyawa
hey
Sammol
hi
God
hello
Jahara
Good morning
Jorge
hi
abubakar
hi
Nmesoma
hi
Mahesh
Hi
Tom
Why is unemployment rate never zero at full employment?
Priyanka Reply
bcoz of existence of frictional unemployment in our economy.
Umashankar
what is flexible exchang rate?
poudel
due to existence of the pple with disabilities
Abdulraufu
the demand of a good rises, causing the demand for another good to fall
Rushawn Reply
is it possible to leave every good at the same level
Joseph
I don't think so. because check it, if the demand for chicken increases, people will no longer consume fish like they used to causing a fall in the demand for fish
Anuolu
is not really possible to let the value of a goods to be same at the same time.....
Salome
Suppose the inflation rate is 6%, does it mean that all the goods you purchase will cost 6% more than previous year? Provide with reasoning.
Geetha Reply
Not necessarily. To measure the inflation rate economists normally use an averaged price index of a basket of certain goods. So if you purchase goods included in the basket, you will notice that you pay 6% more, otherwise not necessarily.
Waeth
discus major problems of macroeconomics
Alii Reply
what is the problem of macroeconomics
Yoal
Economic growth Stable prices and low unemployment
Ephraim
explain inflationcause and itis degre
Miresa Reply
what is inflation
Getu
increase in general price levels
WEETO
Good day How do I calculate this question: C= 100+5yd G= 2000 T= 2000 I(planned)=200. Suppose the actual output is 3000. What is the level of planned expenditures at this level of output?
Chisomo Reply
how to calculate actual output?
Chisomo
how to calculate the equilibrium income
Beshir
Criteria for determining money supply
Thapase Reply
who we can define macroeconomics in one line
Muhammad
Aggregate demand
Mohammed
C=k100 +9y and i=k50.calculate the equilibrium level of output
Mercy Reply
Hi
Isiaka
Hi
Geli
hy
Man
👋
Bahunda
hy how are you?
Man
ys
Amisha
how are you guys
Sekou
f9 guys
Amisha
how are you guys
Sekou
ys am also fine
Amisha
fine and you guys
Geli
from Nepal
Amisha
nawalparasi district from belatari
Amisha
nd u
Amisha
I am Camara from Guinea west Africa... happy to meet you guys here
Sekou
ma management ho
Amisha
ahile becheclor ho
Amisha
hjr ktm bta ho ani k kaam grnu hunxa tw
Amisha
belatari
Amisha
1st year ho
Amisha
nd u
Amisha
ahh
Amisha
kaha biratnagar
Amisha
ys
Amisha
kina k vo
Amisha
money as unit of account means what?
Kalombe
A unit of account is something that can be used to value goods and services and make calculations
Jim
all of you please speak in English I can't understand you're language
Muhammad
I want to know how can we define macroeconomics in one line
Muhammad
it must be .9 or 0.9 no Mpc is greater than 1 Y=100+.9Y+50 Y-.9Y=150 0.1Y/0.1=150/0.1 Y=1500
Kalombe
Mercy is it clear?😋
Kalombe
hi can someone help me on this question If a negative shocks shifts the IS curve to the left, what type of policy do you suggest so as to stabilize the level of output? discuss your answer using appropriate graph.
Galge Reply
if interest rate is increased this will will reduce the level of income shifting the curve to the left ◀️
Kalombe
Got questions? Join the online conversation and get instant answers!
Jobilize.com Reply
Practice Key Terms 5

Get Jobilize Job Search Mobile App in your pocket Now!

Get it on Google Play Download on the App Store Now


Source:  OpenStax, Algebra and trigonometry. OpenStax CNX. Nov 14, 2016 Download for free at https://legacy.cnx.org/content/col11758/1.6
Google Play and the Google Play logo are trademarks of Google Inc.

Notification Switch

Would you like to follow the 'Algebra and trigonometry' conversation and receive update notifications?

Ask