<< Chapter < Page Chapter >> Page >

Access the following online resource for additional instruction and practice with graphs of parametric equations.

Key concepts

  • When there is a third variable, a third parameter on which x and y depend, parametric equations can be used.
  • To graph parametric equations by plotting points, make a table with three columns labeled t , x ( t ) , and y ( t ) . Choose values for t in increasing order. Plot the last two columns for x and y . See [link] and [link] .
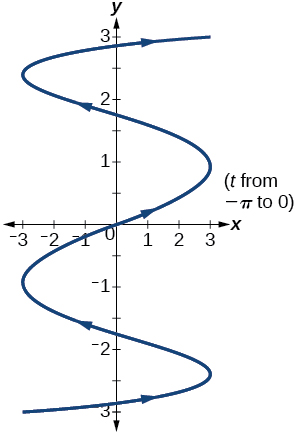
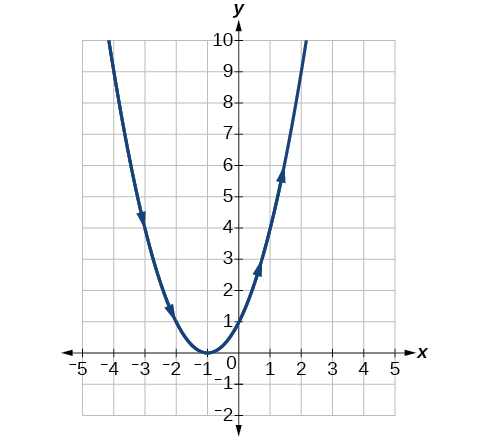
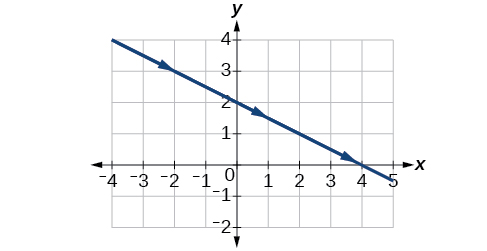
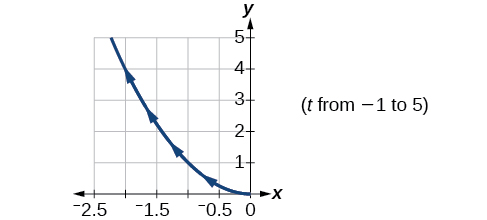
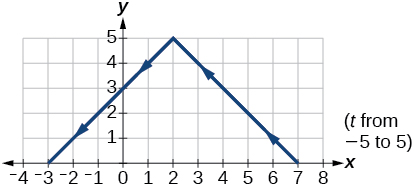
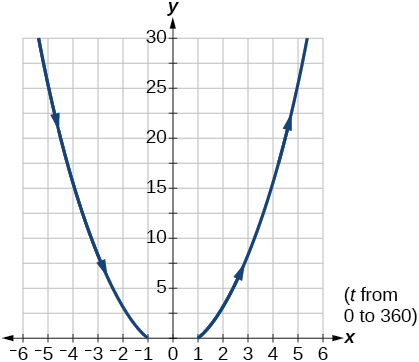
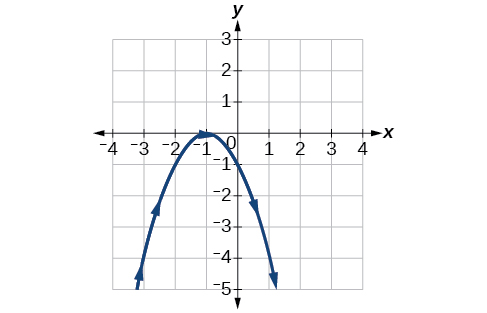
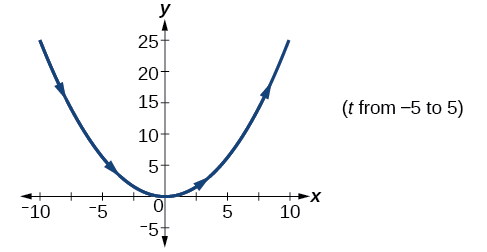
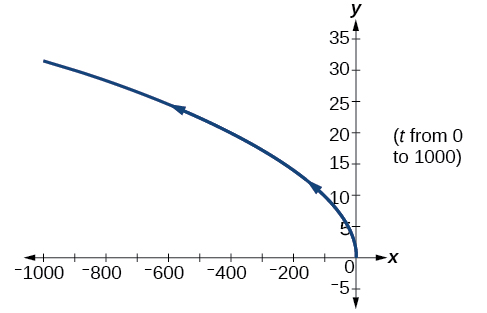
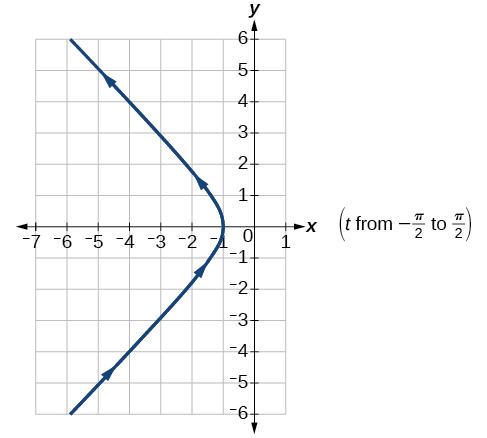
  • When graphing a parametric curve by plotting points, note the associated t -values and show arrows on the graph indicating the orientation of the curve. See [link] and [link] .
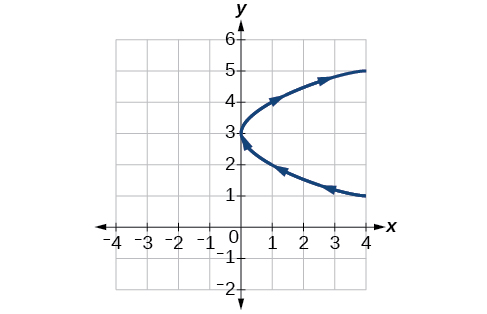
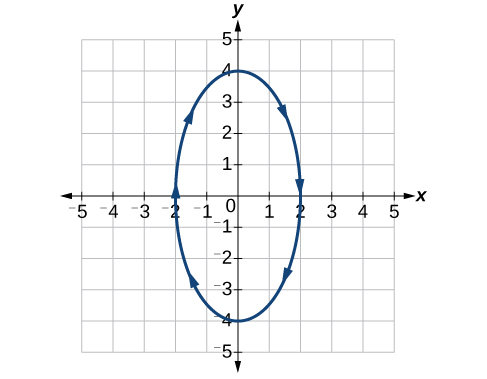
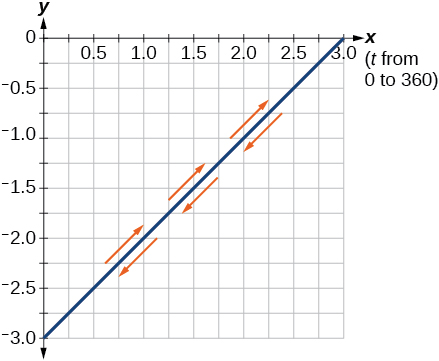
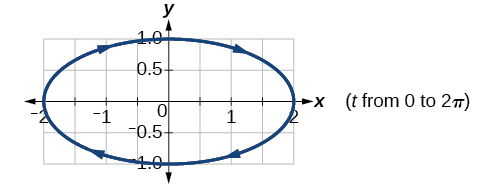
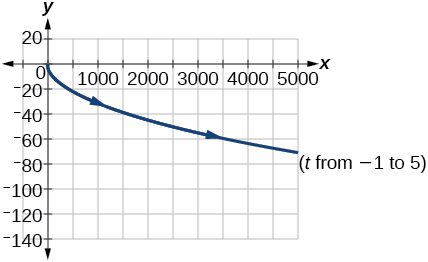
  • Parametric equations allow the direction or the orientation of the curve to be shown on the graph. Equations that are not functions can be graphed and used in many applications involving motion. See [link] .
  • Projectile motion depends on two parametric equations: x = ( v 0 cos θ ) t and y = 16 t 2 + ( v 0 sin θ ) t + h . Initial velocity is symbolized as v 0 . θ represents the initial angle of the object when thrown, and h represents the height at which the object is propelled.

Section exercises

Verbal

What are two methods used to graph parametric equations?

plotting points with the orientation arrow and a graphing calculator

Got questions? Get instant answers now!

What is one difference in point-plotting parametric equations compared to Cartesian equations?

Got questions? Get instant answers now!

Why are some graphs drawn with arrows?

The arrows show the orientation, the direction of motion according to increasing values of t .

Got questions? Get instant answers now!

Name a few common types of graphs of parametric equations.

Got questions? Get instant answers now!

Why are parametric graphs important in understanding projectile motion?

The parametric equations show the different vertical and horizontal motions over time.

Got questions? Get instant answers now!

Graphical

For the following exercises, graph each set of parametric equations by making a table of values. Include the orientation on the graph.

{ x ( t ) = t y ( t ) = t 2 1

t x y
3
2
1
0
1
2
3
Got questions? Get instant answers now!

{ x ( t ) = t 1 y ( t ) = t 2

t 3 2 1 0 1 2
x
y
Graph of the given equations - looks like an upward opening parabola.
Got questions? Get instant answers now!

{ x ( t ) = 2 + t y ( t ) = 3 2 t

t 2 1 0 1 2 3
x
y
Got questions? Get instant answers now!

{ x ( t ) = 2 2 t y ( t ) = 3 + t

t 3 2 1 0 1
x
y
Graph of the given equations - a line, negative slope.
Got questions? Get instant answers now!

{ x ( t ) = t 3 y ( t ) = t + 2

t 2 1 0 1 2
x
y
Got questions? Get instant answers now!

{ x ( t ) = t 2 y ( t ) = t + 3

t 2 1 0 1 2
x
y
Graph of the given equations - looks like a sideways parabola, opening to the right.
Got questions? Get instant answers now!

For the following exercises, sketch the curve and include the orientation.

{ x ( t ) = t y ( t ) = t

Got questions? Get instant answers now!

{ x ( t ) = t y ( t ) = t

Graph of the given equations - looks like the left half of an upward opening parabola.
Got questions? Get instant answers now!

{ x ( t ) = 5 | t | y ( t ) = t + 2

Got questions? Get instant answers now!

{ x ( t ) = t + 2 y ( t ) = 5 | t |

Graph of the given equations - looks like a downward opening absolute value function.
Got questions? Get instant answers now!

{ x ( t ) = 4 sin t y ( t ) = 2 cos t

Got questions? Get instant answers now!

{ x ( t ) = 2 sin t y ( t ) = 4 cos t

Graph of the given equations - a vertical ellipse.
Got questions? Get instant answers now!

{ x ( t ) = 3 cos 2 t y ( t ) = −3 sin t

Got questions? Get instant answers now!

{ x ( t ) = 3 cos 2 t y ( t ) = −3 sin 2 t

Graph of the given equations- line from (0, -3) to (3,0). It is traversed in both directions, positive and negative slope.
Got questions? Get instant answers now!

{ x ( t ) = sec t y ( t ) = tan t

Got questions? Get instant answers now!

{ x ( t ) = sec t y ( t ) = tan 2 t

Graph of the given equations- looks like an upward opening parabola.
Got questions? Get instant answers now!

{ x ( t ) = 1 e 2 t y ( t ) = e t

Got questions? Get instant answers now!

For the following exercises, graph the equation and include the orientation. Then, write the Cartesian equation.

{ x ( t ) = t 1 y ( t ) = t 2

Graph of the given equations- looks like a downward opening parabola.
Got questions? Get instant answers now!

{ x ( t ) = t 3 y ( t ) = t + 3

Got questions? Get instant answers now!

{ x ( t ) = 2 cos t y ( t ) = sin t

Graph of the given equations- horizontal ellipse.

Got questions? Get instant answers now!

{ x ( t ) = 7 cos t y ( t ) = 7 sin t

Got questions? Get instant answers now!

{ x ( t ) = e 2 t y ( t ) = e t

Graph of the given equations- looks like the lower half of a sideways parabola opening to the right
Got questions? Get instant answers now!

For the following exercises, graph the equation and include the orientation.

x = t 2 , y = 3 t , 0 t 5

Got questions? Get instant answers now!

x = 2 t , y = t 2 , 5 t 5

Graph of the given equations- looks like an upwards opening parabola
Got questions? Get instant answers now!

x = t , y = 25 t 2 , 0 < t 5

Got questions? Get instant answers now!

x ( t ) = t , y ( t ) = t , t 0

Graph of the given equations- looks like the upper half of a sideways parabola opening to the left
Got questions? Get instant answers now!

x = 2 cos t , y = 6 sin t , 0 t π

Got questions? Get instant answers now!

x = sec t , y = tan t , π 2 < t < π 2

Graph of the given equations- the left half of a hyperbola with diagonal asymptotes
Got questions? Get instant answers now!

For the following exercises, use the parametric equations for integers a and b :

x ( t ) = a cos ( ( a + b ) t ) y ( t ) = a cos ( ( a b ) t )

Graph on the domain [ π , 0 ] , where a = 2 and b = 1 , and include the orientation.

Got questions? Get instant answers now!

Graph on the domain [ π , 0 ] , where a = 3 and b = 2 , and include the orientation.

Graph of the given equations - vertical periodic trajectory
Got questions? Get instant answers now!

Graph on the domain [ π , 0 ] , where a = 4 and b = 3 , and include the orientation.

Got questions? Get instant answers now!

Questions & Answers

how do you get the 2/50
Abba Reply
number of sport play by 50 student construct discrete data
Aminu Reply
width of the frangebany leaves on how to write a introduction
Theresa Reply
Solve the mean of variance
Veronica Reply
Step 1: Find the mean. To find the mean, add up all the scores, then divide them by the number of scores. ... Step 2: Find each score's deviation from the mean. ... Step 3: Square each deviation from the mean. ... Step 4: Find the sum of squares. ... Step 5: Divide the sum of squares by n – 1 or N.
kenneth
what is error
Yakuba Reply
Is mistake done to something
Vutshila
Hy
anas
hy
What is the life teble
anas
hy
Jibrin
statistics is the analyzing of data
Tajudeen Reply
what is statics?
Zelalem Reply
how do you calculate mean
Gloria Reply
diveving the sum if all values
Shaynaynay
let A1,A2 and A3 events be independent,show that (A1)^c, (A2)^c and (A3)^c are independent?
Fisaye Reply
what is statistics
Akhisani Reply
data collected all over the world
Shaynaynay
construct a less than and more than table
Imad Reply
The sample of 16 students is taken. The average age in the sample was 22 years with astandard deviation of 6 years. Construct a 95% confidence interval for the age of the population.
Aschalew Reply
Bhartdarshan' is an internet-based travel agency wherein customer can see videos of the cities they plant to visit. The number of hits daily is a normally distributed random variable with a mean of 10,000 and a standard deviation of 2,400 a. what is the probability of getting more than 12,000 hits? b. what is the probability of getting fewer than 9,000 hits?
Akshay Reply
Bhartdarshan'is an internet-based travel agency wherein customer can see videos of the cities they plan to visit. The number of hits daily is a normally distributed random variable with a mean of 10,000 and a standard deviation of 2,400. a. What is the probability of getting more than 12,000 hits
Akshay
1
Bright
Sorry i want to learn more about this question
Bright
Someone help
Bright
a= 0.20233 b=0.3384
Sufiyan
a
Shaynaynay
How do I interpret level of significance?
Mohd Reply
It depends on your business problem or in Machine Learning you could use ROC- AUC cruve to decide the threshold value
Shivam
how skewness and kurtosis are used in statistics
Owen Reply
yes what is it
Taneeya
Got questions? Join the online conversation and get instant answers!
Jobilize.com Reply

Get Jobilize Job Search Mobile App in your pocket Now!

Get it on Google Play Download on the App Store Now


Source:  OpenStax, Algebra and trigonometry. OpenStax CNX. Nov 14, 2016 Download for free at https://legacy.cnx.org/content/col11758/1.6
Google Play and the Google Play logo are trademarks of Google Inc.

Notification Switch

Would you like to follow the 'Algebra and trigonometry' conversation and receive update notifications?

Ask