<< Chapter < Page Chapter >> Page >

Finding zeros and maximum values for a polar equation

Using the equation in [link] , find the zeros and maximum | r | and, if necessary, the polar axis intercepts of r = 2 sin θ .

To find the zeros, set r equal to zero and solve for θ .

2 sin θ = 0 sin θ = 0 θ = sin 1 0 θ = n π where  n  is an integer

Substitute any one of the θ values into the equation. We will use 0.

r = 2 sin ( 0 ) r = 0

The points ( 0 , 0 ) and ( 0 , ± n π ) are the zeros of the equation. They all coincide, so only one point is visible on the graph. This point is also the only polar axis intercept.

To find the maximum value of the equation, look at the maximum value of the trigonometric function sin θ , which occurs when θ = π 2 ± 2 k π resulting in sin ( π 2 ) = 1. Substitute π 2 for θ.

r = 2 sin ( π 2 ) r = 2 ( 1 ) r = 2
Got questions? Get instant answers now!

Without converting to Cartesian coordinates, test the given equation for symmetry and find the zeros and maximum values of | r | : r = 3 cos θ .

Tests will reveal symmetry about the polar axis. The zero is ( 0 , π 2 ) , and the maximum value is ( 3 , 0 ) .

Got questions? Get instant answers now!

Investigating circles

Now we have seen the equation of a circle in the polar coordinate system. In the last two examples, the same equation was used to illustrate the properties of symmetry and demonstrate how to find the zeros, maximum values, and plotted points that produced the graphs. However, the circle is only one of many shapes in the set of polar curves.

There are five classic polar curves : cardioids , limaҫons, lemniscates, rose curves , and Archimedes’ spirals . We will briefly touch on the polar formulas for the circle before moving on to the classic curves and their variations.

Formulas for the equation of a circle

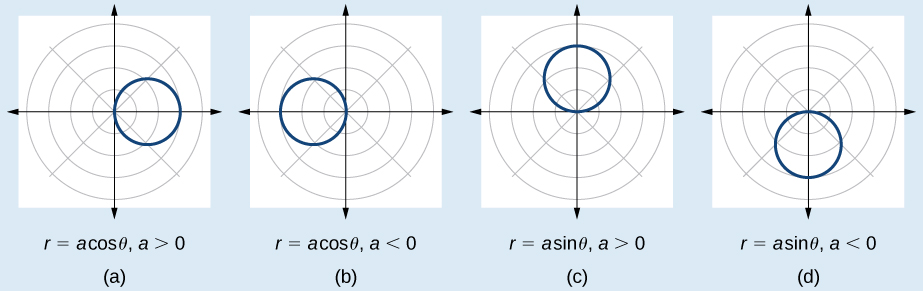
Some of the formulas that produce the graph of a circle in polar coordinates are given by r = a cos θ and r = a sin θ , where a is the diameter of the circle or the distance from the pole to the farthest point on the circumference. The radius is | a | 2 , or one-half the diameter. For r = a cos θ ,  the center is ( a 2 , 0 ) . For r = a sin θ , the center is ( a 2 , π ) . [link] shows the graphs of these four circles.
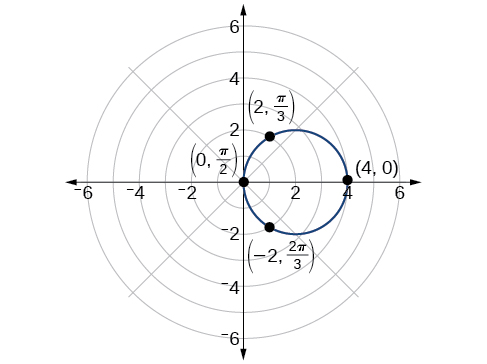
Four graphs side by side. All have radius absolute value of a / 2. First is r=acos(theta), a>0. The center is at (a/2,0). Second is r=acos(theta), a<0. The center is at (a/2,0).  Third is r=asin(theta), a>0. The center is at (a/2, pi). Fourth is r=asin(theta), a<0. The center is at (a/2, pi).

Sketching the graph of a polar equation for a circle

Sketch the graph of r = 4 cos θ .

First, testing the equation for symmetry, we find that the graph is symmetric about the polar axis. Next, we find the zeros    and maximum | r | for r = 4 cos θ . First, set r = 0 , and solve for θ . Thus, a zero occurs at θ = π 2 ± k π . A key point to plot is ( 0 , π 2 ) .

To find the maximum value of r , note that the maximum value of the cosine function is 1 when θ = 0 ± 2 k π . Substitute θ = 0 into the equation:

r = 4 cos θ r = 4 cos ( 0 ) r = 4 ( 1 ) = 4

The maximum value of the equation is 4. A key point to plot is ( 4 , 0 ) .

As r = 4 cos θ is symmetric with respect to the polar axis, we only need to calculate r -values for θ over the interval [ 0 , π ] . Points in the upper quadrant can then be reflected to the lower quadrant. Make a table of values similar to [link] . The graph is shown in [link] .

θ 0 π 6 π 4 π 3 π 2 2 π 3 3 π 4 5 π 6 π
r 4 3.46 2.83 2 0 −2 −2.83 −3.46 4
Graph of 4=4cos(theta) in polar coordinates. Points (0, pi/2), (-2, 2pi/3), (4,0), and (2, pi/3) are marked on the circumference.
Got questions? Get instant answers now!

Investigating cardioids

While translating from polar coordinates to Cartesian coordinates may seem simpler in some instances, graphing the classic curves is actually less complicated in the polar system. The next curve is called a cardioid, as it resembles a heart. This shape is often included with the family of curves called limaçons, but here we will discuss the cardioid on its own.

Questions & Answers

differentiate between demand and supply giving examples
Lambiv Reply
differentiated between demand and supply using examples
Lambiv
what is labour ?
Lambiv
how will I do?
Venny Reply
how is the graph works?I don't fully understand
Rezat Reply
information
Eliyee
devaluation
Eliyee
t
WARKISA
hi guys good evening to all
Lambiv
multiple choice question
Aster Reply
appreciation
Eliyee
explain perfect market
Lindiwe Reply
In economics, a perfect market refers to a theoretical construct where all participants have perfect information, goods are homogenous, there are no barriers to entry or exit, and prices are determined solely by supply and demand. It's an idealized model used for analysis,
Ezea
What is ceteris paribus?
Shukri Reply
other things being equal
AI-Robot
When MP₁ becomes negative, TP start to decline. Extuples Suppose that the short-run production function of certain cut-flower firm is given by: Q=4KL-0.6K2 - 0.112 • Where is quantity of cut flower produced, I is labour input and K is fixed capital input (K-5). Determine the average product of lab
Kelo
Extuples Suppose that the short-run production function of certain cut-flower firm is given by: Q=4KL-0.6K2 - 0.112 • Where is quantity of cut flower produced, I is labour input and K is fixed capital input (K-5). Determine the average product of labour (APL) and marginal product of labour (MPL)
Kelo
yes,thank you
Shukri
Can I ask you other question?
Shukri
what is monopoly mean?
Habtamu Reply
What is different between quantity demand and demand?
Shukri Reply
Quantity demanded refers to the specific amount of a good or service that consumers are willing and able to purchase at a give price and within a specific time period. Demand, on the other hand, is a broader concept that encompasses the entire relationship between price and quantity demanded
Ezea
ok
Shukri
how do you save a country economic situation when it's falling apart
Lilia Reply
what is the difference between economic growth and development
Fiker Reply
Economic growth as an increase in the production and consumption of goods and services within an economy.but Economic development as a broader concept that encompasses not only economic growth but also social & human well being.
Shukri
production function means
Jabir
What do you think is more important to focus on when considering inequality ?
Abdisa Reply
any question about economics?
Awais Reply
sir...I just want to ask one question... Define the term contract curve? if you are free please help me to find this answer 🙏
Asui
it is a curve that we get after connecting the pareto optimal combinations of two consumers after their mutually beneficial trade offs
Awais
thank you so much 👍 sir
Asui
In economics, the contract curve refers to the set of points in an Edgeworth box diagram where both parties involved in a trade cannot be made better off without making one of them worse off. It represents the Pareto efficient allocations of goods between two individuals or entities, where neither p
Cornelius
In economics, the contract curve refers to the set of points in an Edgeworth box diagram where both parties involved in a trade cannot be made better off without making one of them worse off. It represents the Pareto efficient allocations of goods between two individuals or entities,
Cornelius
Suppose a consumer consuming two commodities X and Y has The following utility function u=X0.4 Y0.6. If the price of the X and Y are 2 and 3 respectively and income Constraint is birr 50. A,Calculate quantities of x and y which maximize utility. B,Calculate value of Lagrange multiplier. C,Calculate quantities of X and Y consumed with a given price. D,alculate optimum level of output .
Feyisa Reply
Answer
Feyisa
c
Jabir
the market for lemon has 10 potential consumers, each having an individual demand curve p=101-10Qi, where p is price in dollar's per cup and Qi is the number of cups demanded per week by the i th consumer.Find the market demand curve using algebra. Draw an individual demand curve and the market dema
Gsbwnw Reply
suppose the production function is given by ( L, K)=L¼K¾.assuming capital is fixed find APL and MPL. consider the following short run production function:Q=6L²-0.4L³ a) find the value of L that maximizes output b)find the value of L that maximizes marginal product
Abdureman
types of unemployment
Yomi Reply
What is the difference between perfect competition and monopolistic competition?
Mohammed
Got questions? Join the online conversation and get instant answers!
Jobilize.com Reply
Practice Key Terms 9

Get Jobilize Job Search Mobile App in your pocket Now!

Get it on Google Play Download on the App Store Now


Source:  OpenStax, Algebra and trigonometry. OpenStax CNX. Nov 14, 2016 Download for free at https://legacy.cnx.org/content/col11758/1.6
Google Play and the Google Play logo are trademarks of Google Inc.

Notification Switch

Would you like to follow the 'Algebra and trigonometry' conversation and receive update notifications?

Ask