<< Chapter < Page Chapter >> Page >
This figure shows three graphs labeled a, b, and c. Graph a shows an increasing function (f) along the x-axis and the y-axis which is labeled f of x. Graph b shows a decreasing function (f) along the x-axis and y-axis which is labeled f of x. Graph c shows a constant function (f) along the x-axis and y-axis which is labeled f of x. The constant function is horizontal. None of the graphs have any increments labeled on the x- or y-axis.

Increasing and decreasing functions

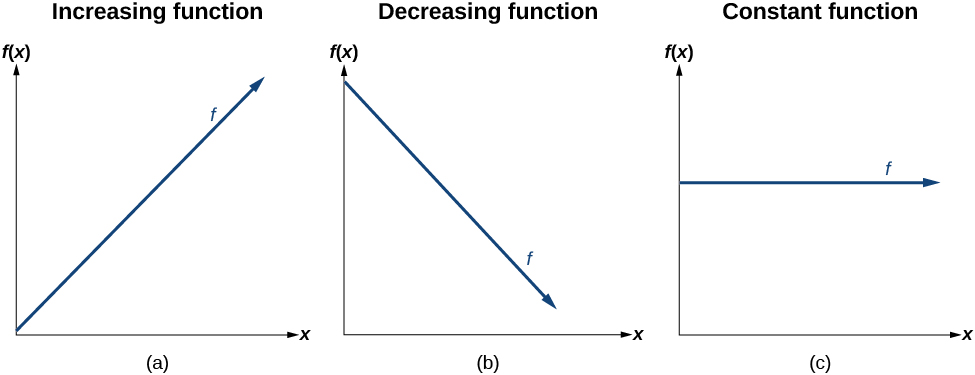
The slope determines if the function is an increasing linear function    , a decreasing linear function    , or a constant function.

  • f ( x ) = m x + b is an increasing function if m > 0.
  • f ( x ) = m x + b is a decreasing function if m < 0.
  • f ( x ) = m x + b is a constant function if m = 0.

Deciding whether a function is increasing, decreasing, or constant

Some recent studies suggest that a teenager sends an average of 60 texts per day http://www.cbsnews.com/8301-501465_162-57400228-501465/teens-are-sending-60-texts-a-day-study-says/ . For each of the following scenarios, find the linear function that describes the relationship between the input value and the output value. Then, determine whether the graph of the function is increasing, decreasing, or constant.

  1. The total number of texts a teen sends is considered a function of time in days. The input is the number of days, and output is the total number of texts sent.
  2. A teen has a limit of 500 texts per month in his or her data plan. The input is the number of days, and output is the total number of texts remaining for the month.
  3. A teen has an unlimited number of texts in his or her data plan for a cost of $50 per month. The input is the number of days, and output is the total cost of texting each month.

Analyze each function.

  1. The function can be represented as f ( x ) = 60 x where x is the number of days. The slope, 60, is positive so the function is increasing. This makes sense because the total number of texts increases with each day.
  2. The function can be represented as f ( x ) = 500 60 x where x is the number of days. In this case, the slope is negative so the function is decreasing. This makes sense because the number of texts remaining decreases each day and this function represents the number of texts remaining in the data plan after x days.
  3. The cost function can be represented as f ( x ) = 50 because the number of days does not affect the total cost. The slope is 0 so the function is constant.
Got questions? Get instant answers now!

Interpreting slope as a rate of change

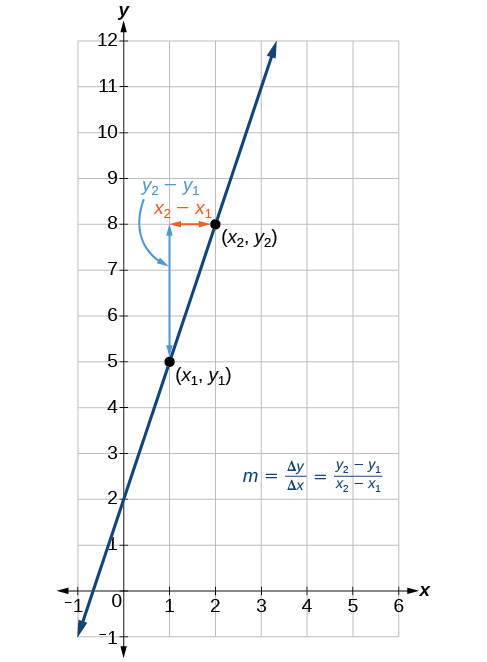
In the examples we have seen so far, the slope was provided to us. However, we often need to calculate the slope given input and output values. Recall that given two values for the input, x 1 and x 2 , and two corresponding values for the output, y 1 and y 2 —which can be represented by a set of points, ( x 1 y 1 ) and ( x 2 y 2 ) —we can calculate the slope m .

m = change in output (rise) change in input (run) = Δ y Δ x = y 2 y 1 x 2 x 1

Note that in function notation we can obtain two corresponding values for the output y 1 and y 2 for the function f , y 1 = f ( x 1 ) and y 2 = f ( x 2 ) , so we could equivalently write

m = f ( x 2 ) f ( x 1 ) x 2 x 1

[link] indicates how the slope of the line between the points, ( x 1 , y 1 ) and ( x 2 , y 2 ) , is calculated. Recall that the slope measures steepness, or slant. The greater the absolute value of the slope, the steeper the slant is.

This graph shows how to calculate the slope of a line. The line is graphed on an x y coordinate plane. The x-axis is labeled from negative 1 to 6. The y-axis is labeled from negative 1 to 10. The line passes through several points, but two are marked specifcally. The first is labeled (x subscript 1, y subscript 1). It is located at the point (1, 5). The second point is labeled (x subscript 2, y subscript 2). It is located at the point (2, 8). There is a small arrow that runs horizontally from point (2, 8) to point (1, 8). This arrow is labeled x subscript 2 minus x subscript 1. There is a blue arrow that runs vertically from point (1, 5) to point (1, 8) and is labeled y subscript 2 minus y subscript 1. Off to the side is the equation m equals delta y divided by delta x which equals y subscript 2 minus y subscript 1 divided by x subscript 2 minus x subscript 1.
The slope of a function is calculated by the change in y divided by the change in x . It does not matter which coordinate is used as the ( x 2 , y 2 ) and which is the ( x 1 , y 1 ) , as long as each calculation is started with the elements from the same coordinate pair.

Questions & Answers

calculate molarity of NaOH solution when 25.0ml of NaOH titrated with 27.2ml of 0.2m H2SO4
Gasin Reply
what's Thermochemistry
rhoda Reply
the study of the heat energy which is associated with chemical reactions
Kaddija
How was CH4 and o2 was able to produce (Co2)and (H2o
Edafe Reply
explain please
Victory
First twenty elements with their valences
Martine Reply
what is chemistry
asue Reply
what is atom
asue
what is the best way to define periodic table for jamb
Damilola Reply
what is the change of matter from one state to another
Elijah Reply
what is isolation of organic compounds
IKyernum Reply
what is atomic radius
ThankGod Reply
Read Chapter 6, section 5
Dr
Read Chapter 6, section 5
Kareem
Atomic radius is the radius of the atom and is also called the orbital radius
Kareem
atomic radius is the distance between the nucleus of an atom and its valence shell
Amos
Read Chapter 6, section 5
paulino
Bohr's model of the theory atom
Ayom Reply
is there a question?
Dr
when a gas is compressed why it becomes hot?
ATOMIC
It has no oxygen then
Goldyei
read the chapter on thermochemistry...the sections on "PV" work and the First Law of Thermodynamics should help..
Dr
Which element react with water
Mukthar Reply
Mgo
Ibeh
an increase in the pressure of a gas results in the decrease of its
Valentina Reply
definition of the periodic table
Cosmos Reply
What is the lkenes
Da Reply
what were atoms composed of?
Moses Reply
Got questions? Join the online conversation and get instant answers!
Jobilize.com Reply

Get Jobilize Job Search Mobile App in your pocket Now!

Get it on Google Play Download on the App Store Now


Source:  OpenStax, Algebra and trigonometry. OpenStax CNX. Nov 14, 2016 Download for free at https://legacy.cnx.org/content/col11758/1.6
Google Play and the Google Play logo are trademarks of Google Inc.

Notification Switch

Would you like to follow the 'Algebra and trigonometry' conversation and receive update notifications?

Ask