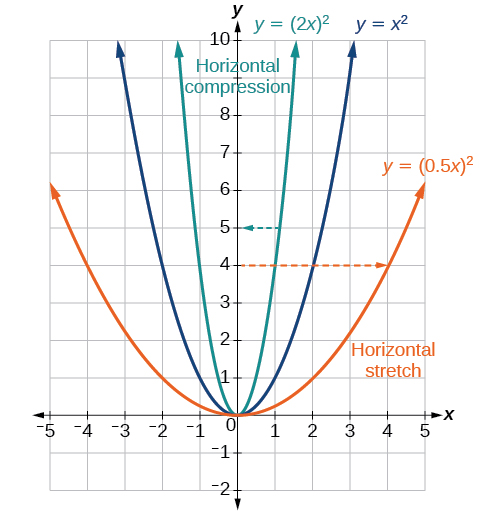
Now we consider changes to the inside of a function. When we multiply a function’s input by a positive constant, we get a function whose graph is stretched or compressed horizontally in relation to the graph of the original function. If the constant is between 0 and 1, we get a
horizontal stretch ; if the constant is greater than 1, we get a
horizontal compression of the function.
Given a function
the form
results in a horizontal stretch or compression. Consider the function
Observe
[link] . The graph of
is a horizontal stretch of the graph of the function
by a factor of 2. The graph of
is a horizontal compression of the graph of the function
by a factor of 2.
Horizontal stretches and compressions
Given a function
a new function
where
is a constant, is a
horizontal stretch or
horizontal compression of the function
If
then the graph will be compressed by
If
then the graph will be stretched by
If
then there will be combination of a horizontal stretch or compression with a horizontal reflection.
Given a description of a function, sketch a horizontal compression or stretch.
Write a formula to represent the function.
Set
where
for a compression or
for a stretch.
Graphing a horizontal compression
Suppose a scientist is comparing a population of fruit flies to a population that progresses through its lifespan twice as fast as the original population. In other words, this new population,
will progress in 1 hour the same amount as the original population does in 2 hours, and in 2 hours, it will progress as much as the original population does in 4 hours. Sketch a graph of this population.
Symbolically, we could write
See
[link] for a graphical comparison of the original population and the compressed population.
(a) Original population graph (b) Compressed population graph
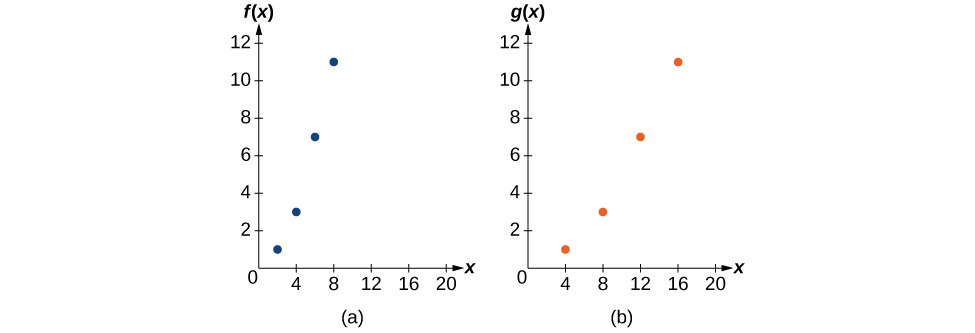
Finding a horizontal stretch for a tabular function
A function
is given as
[link] . Create a table for the function
2
4
6
8
1
3
7
11
The formula
tells us that the output values for
are the same as the output values for the function
at an input half the size. Notice that we do not have enough information to determine
because
and we do not have a value for
in our table. Our input values to
will need to be twice as large to get inputs for
that we can evaluate. For example, we can determine
We do the same for the other values to produce
[link] .
4
8
12
16
1
3
7
11
[link] shows the graphs of both of these sets of points.
The graph of
looks like the graph of
horizontally compressed. Because
ends at
and
ends at
we can see that the
values have been compressed by
because
We might also notice that
and
Either way, we can describe this relationship as
This is a horizontal compression by
In economics, a perfect market refers to a theoretical construct where all participants have perfect information, goods are homogenous, there are no barriers to entry or exit, and prices are determined solely by supply and demand. It's an idealized model used for analysis,
When MP₁ becomes negative, TP start to decline.
Extuples Suppose that the short-run production function of certain cut-flower firm is given by: Q=4KL-0.6K2 - 0.112 •
Where is quantity of cut flower produced, I is labour input and K is fixed capital input (K-5). Determine the average product of lab
Kelo
Extuples Suppose that the short-run production function of certain cut-flower firm is given by: Q=4KL-0.6K2 - 0.112 •
Where is quantity of cut flower produced, I is labour input and K is fixed capital input (K-5). Determine the average product of labour (APL) and marginal product of labour (MPL)
Quantity demanded refers to the specific amount of a good or service that consumers are willing and able to purchase at a give price and within a specific time period. Demand, on the other hand, is a broader concept that encompasses the entire relationship between price and quantity demanded
Ezea
ok
Shukri
how do you save a country economic situation when it's falling apart
Economic growth as an increase in the production and consumption of goods and services within an economy.but
Economic development as a broader concept that encompasses not only economic growth but also social & human well being.
Shukri
production function means
Jabir
What do you think is more important to focus on when considering inequality ?
sir...I just want to ask one question... Define the term contract curve? if you are free please help me to find this answer 🙏
Asui
it is a curve that we get after connecting the pareto optimal combinations of two consumers after their mutually beneficial trade offs
Awais
thank you so much 👍 sir
Asui
In economics, the contract curve refers to the set of points in an Edgeworth box diagram where both parties involved in a trade cannot be made better off without making one of them worse off. It represents the Pareto efficient allocations of goods between two individuals or entities, where neither p
Cornelius
In economics, the contract curve refers to the set of points in an Edgeworth box diagram where both parties involved in a trade cannot be made better off without making one of them worse off. It represents the Pareto efficient allocations of goods between two individuals or entities,
Cornelius
Suppose a consumer consuming two commodities X and Y has
The following utility function u=X0.4 Y0.6. If the price of the X and Y are 2 and 3 respectively and income Constraint is birr 50.
A,Calculate quantities of x and y which maximize utility.
B,Calculate value of Lagrange multiplier.
C,Calculate quantities of X and Y consumed with a given price.
D,alculate optimum level of output .
the market for lemon has 10 potential consumers, each having an individual demand curve p=101-10Qi, where p is price in dollar's per cup and Qi is the number of cups demanded per week by the i th consumer.Find the market demand curve using algebra. Draw an individual demand curve and the market dema
suppose the production function is given by ( L, K)=L¼K¾.assuming capital is fixed find APL and MPL. consider the following short run production function:Q=6L²-0.4L³ a) find the value of L that maximizes output b)find the value of L that maximizes marginal product


![Two side-by-side graphs. The first graph has function for original population whose domain is [0,7] and range is [0,3]. The maximum value occurs at (3,3). The second graph has the same shape as the first except it is half as wide. It is a graph of transformed population, with a domain of [0, 3.5] and a range of [0,3]. The maximum occurs at (1.5, 3).](/ocw/mirror/col11758/m51266/CNX_Precalc_Figure_01_05_029ab.jpg)