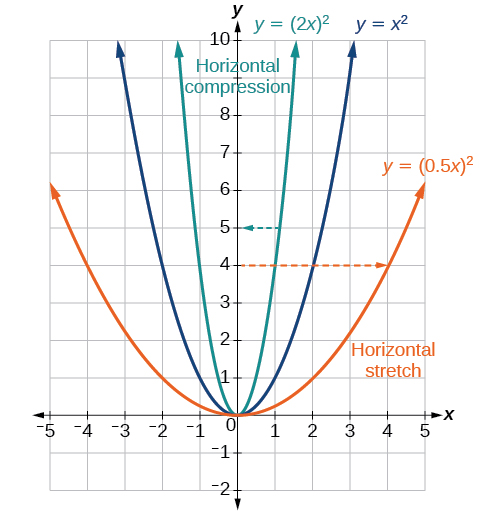
Now we consider changes to the inside of a function. When we multiply a function’s input by a positive constant, we get a function whose graph is stretched or compressed horizontally in relation to the graph of the original function. If the constant is between 0 and 1, we get a
horizontal stretch ; if the constant is greater than 1, we get a
horizontal compression of the function.
Given a function
the form
results in a horizontal stretch or compression. Consider the function
Observe
[link] . The graph of
is a horizontal stretch of the graph of the function
by a factor of 2. The graph of
is a horizontal compression of the graph of the function
by a factor of 2.
Horizontal stretches and compressions
Given a function
a new function
where
is a constant, is a
horizontal stretch or
horizontal compression of the function
If
then the graph will be compressed by
If
then the graph will be stretched by
If
then there will be combination of a horizontal stretch or compression with a horizontal reflection.
Given a description of a function, sketch a horizontal compression or stretch.
Write a formula to represent the function.
Set
where
for a compression or
for a stretch.
Graphing a horizontal compression
Suppose a scientist is comparing a population of fruit flies to a population that progresses through its lifespan twice as fast as the original population. In other words, this new population,
will progress in 1 hour the same amount as the original population does in 2 hours, and in 2 hours, it will progress as much as the original population does in 4 hours. Sketch a graph of this population.
Symbolically, we could write
See
[link] for a graphical comparison of the original population and the compressed population.
(a) Original population graph (b) Compressed population graph
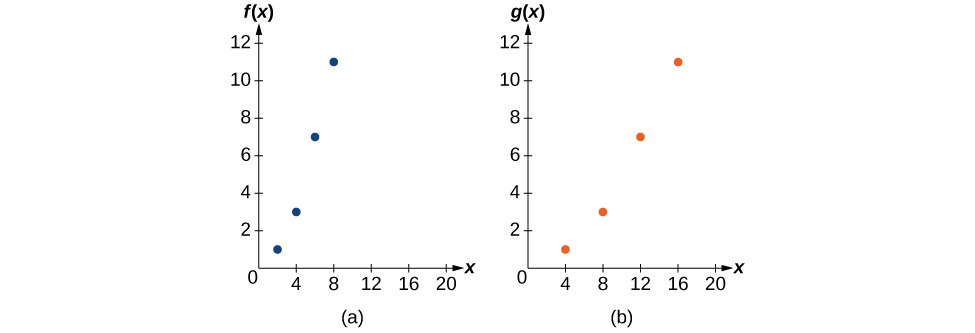
Finding a horizontal stretch for a tabular function
A function
is given as
[link] . Create a table for the function
2
4
6
8
1
3
7
11
The formula
tells us that the output values for
are the same as the output values for the function
at an input half the size. Notice that we do not have enough information to determine
because
and we do not have a value for
in our table. Our input values to
will need to be twice as large to get inputs for
that we can evaluate. For example, we can determine
We do the same for the other values to produce
[link] .
4
8
12
16
1
3
7
11
[link] shows the graphs of both of these sets of points.
The graph of
looks like the graph of
horizontally compressed. Because
ends at
and
ends at
we can see that the
values have been compressed by
because
We might also notice that
and
Either way, we can describe this relationship as
This is a horizontal compression by
what's the difference between a firm and an industry
Abdul
firm is the unit which transform inputs to output where as industry contain combination of firms with similar production 😅😅
Abdulraufu
Suppose the demand function that a firm faces shifted from
Qd 120 3P
to
Qd 90 3P
and the supply function has shifted from
QS
20 2P
to
QS
10 2P .
a) Find the effect of this change on price and quantity.
b) Which of the changes in demand and supply is higher?
Demand curve shows that how supply and others conditions affect on demand of a particular thing and what percent demand increase whith increase of supply of goods
Israr
Hi Sir please how do u calculate Cross elastic demand and income elastic demand?
Abari
Got questions? Join the online conversation and get instant answers!


![Two side-by-side graphs. The first graph has function for original population whose domain is [0,7] and range is [0,3]. The maximum value occurs at (3,3). The second graph has the same shape as the first except it is half as wide. It is a graph of transformed population, with a domain of [0, 3.5] and a range of [0,3]. The maximum occurs at (1.5, 3).](/ocw/mirror/col11758/m51266/CNX_Precalc_Figure_01_05_029ab.jpg)