| << Chapter < Page | Chapter >> Page > |
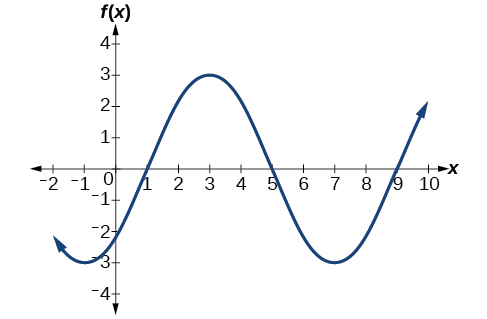
Write a formula for the function graphed in [link] .
![A graph of 4sin((pi/5)x-pi/5)+4. Graph has period of 10, amplitude of 4, range of [0,8].](/ocw/mirror/col11758/m49387/CNX_Precalc_Figure_06_01_018n.jpg)
two possibilities: or
Throughout this section, we have learned about types of variations of sine and cosine functions and used that information to write equations from graphs. Now we can use the same information to create graphs from equations.
Instead of focusing on the general form equations
we will let and and work with a simplified form of the equations in the following examples.
Given the function sketch its graph.
Sketch a graph of
Let’s begin by comparing the equation to the form
The quarter points include the minimum at and the maximum at A local minimum will occur 2 units below the midline, at and a local maximum will occur at 2 units above the midline, at [link] shows the graph of the function.
![A graph of -2sin((pi/2)x). Graph has range of [-2,2], period of 4, and amplitude of 2.](/ocw/mirror/col11758/m49387/CNX_Precalc_Figure_06_01_019.jpg)
Sketch a graph of Determine the midline, amplitude, period, and phase shift.
![A graph of -0.8cos(2x). Graph has range of [-0.8, 0.8], period of pi, amplitude of 0.8, and is reflected about the x-axis compared to it's parent function cos(x).](/ocw/mirror/col11758/m49387/CNX_Precalc_Figure_06_01_020.jpg)
midline: amplitude: period: phase shift: or none
Given a sinusoidal function with a phase shift and a vertical shift, sketch its graph.
Sketch a graph of
The period is 8.
The phase shift is 1 unit.

Draw a graph of Determine the midline, amplitude, period, and phase shift.

midline: amplitude: period: phase shift:

Notification Switch
Would you like to follow the 'Algebra and trigonometry' conversation and receive update notifications?