<< Chapter < Page Chapter >> Page >

Write a formula for the function graphed in [link] .

A graph of 4sin((pi/5)x-pi/5)+4. Graph has period of 10, amplitude of 4, range of [0,8].

two possibilities: y = 4 sin ( π 5 x π 5 ) + 4 or y = 4 sin ( π 5 x + 4 π 5 ) + 4

Got questions? Get instant answers now!

Graphing variations of y = sin x And y = cos x

Throughout this section, we have learned about types of variations of sine and cosine functions and used that information to write equations from graphs. Now we can use the same information to create graphs from equations.

Instead of focusing on the general form equations

y = A sin ( B x C ) + D  and  y = A cos ( B x C ) + D ,

we will let C = 0 and D = 0 and work with a simplified form of the equations in the following examples.

Given the function y = A sin ( B x ) , sketch its graph.

  1. Identify the amplitude, | A | .
  2. Identify the period, P = 2 π | B | .
  3. Start at the origin, with the function increasing to the right if A is positive or decreasing if A is negative.
  4. At x = π 2 | B | there is a local maximum for A > 0 or a minimum for A < 0 , with y = A .
  5. The curve returns to the x -axis at x = π | B | .
  6. There is a local minimum for A > 0 (maximum for A < 0 ) at x = 3 π 2 | B | with y = A .
  7. The curve returns again to the x -axis at x = π 2 | B | .

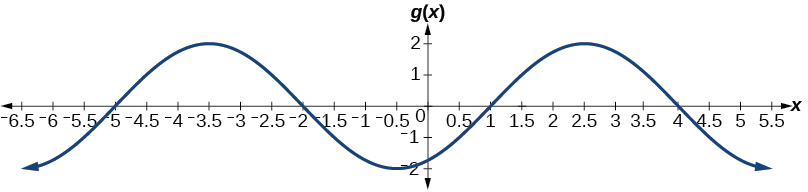
Graphing a function and identifying the amplitude and period

Sketch a graph of f ( x ) = 2 sin ( π x 2 ) .

Let’s begin by comparing the equation to the form y = A sin ( B x ) .

  • Step 1. We can see from the equation that A = 2 , so the amplitude is 2.
    | A | = 2
  • Step 2. The equation shows that B = π 2 , so the period is
    P = 2 π π 2    = 2 π 2 π    = 4
  • Step 3. Because A is negative, the graph descends as we move to the right of the origin.
  • Step 4–7. The x -intercepts are at the beginning of one period, x = 0 , the horizontal midpoints are at x = 2 and at the end of one period at x = 4.

The quarter points include the minimum at x = 1 and the maximum at x = 3. A local minimum will occur 2 units below the midline, at x = 1 , and a local maximum will occur at 2 units above the midline, at x = 3. [link] shows the graph of the function.

A graph of -2sin((pi/2)x). Graph has range of [-2,2], period of 4, and amplitude of 2.
Got questions? Get instant answers now!

Sketch a graph of g ( x ) = 0.8 cos ( 2 x ) . Determine the midline, amplitude, period, and phase shift.

A graph of -0.8cos(2x). Graph has range of [-0.8, 0.8], period of pi, amplitude of 0.8, and is reflected about the x-axis compared to it's parent function cos(x).

midline: y = 0 ; amplitude: | A | = 0.8 ; period: P = 2 π | B | = π ; phase shift: C B = 0 or none

Got questions? Get instant answers now!

Given a sinusoidal function with a phase shift and a vertical shift, sketch its graph.

  1. Express the function in the general form y = A sin ( B x C ) + D  or  y = A cos ( B x C ) + D .
  2. Identify the amplitude, | A | .
  3. Identify the period, P = 2 π | B | .
  4. Identify the phase shift, C B .
  5. Draw the graph of f ( x ) = A sin ( B x ) shifted to the right or left by C B and up or down by D .

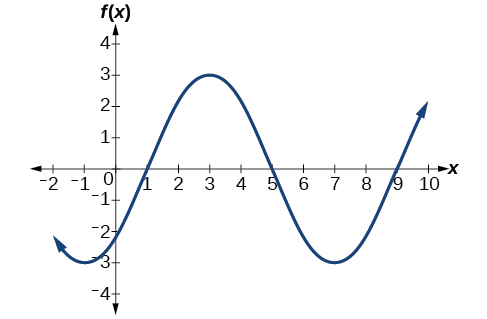
Graphing a transformed sinusoid

Sketch a graph of f ( x ) = 3 sin ( π 4 x π 4 ) .

  • Step 1. The function is already written in general form: f ( x ) = 3 sin ( π 4 x π 4 ) . This graph will have the shape of a sine function    , starting at the midline and increasing to the right.
  • Step 2. | A | = | 3 | = 3. The amplitude is 3.
  • Step 3. Since | B | = | π 4 | = π 4 , we determine the period as follows.
    P = 2 π | B | = 2 π π 4 = 2 π 4 π = 8

    The period is 8.

  • Step 4. Since C = π 4 , the phase shift is
    C B = π 4 π 4 = 1.

    The phase shift is 1 unit.

  • Step 5. [link] shows the graph of the function.
    A graph of 3sin(*(pi/4)x-pi/4). Graph has amplitude of 3, period of 8, and a phase shift of 1 to the right.
    A horizontally compressed, vertically stretched, and horizontally shifted sinusoid
Got questions? Get instant answers now!

Draw a graph of g ( x ) = 2 cos ( π 3 x + π 6 ) . Determine the midline, amplitude, period, and phase shift.

A graph of -2cos((pi/3)x+(pi/6)). Graph has amplitude of 2, period of 6, and has a phase shift of 0.5 to the left.

midline: y = 0 ; amplitude: | A | = 2 ; period: P = 2 π | B | = 6 ; phase shift: C B = 1 2

Got questions? Get instant answers now!

Questions & Answers

Ayele, K., 2003. Introductory Economics, 3rd ed., Addis Ababa.
Widad Reply
can you send the book attached ?
Ariel
?
Ariel
What is economics
Widad Reply
the study of how humans make choices under conditions of scarcity
AI-Robot
U(x,y) = (x×y)1/2 find mu of x for y
Desalegn Reply
U(x,y) = (x×y)1/2 find mu of x for y
Desalegn
what is ecnomics
Jan Reply
this is the study of how the society manages it's scarce resources
Belonwu
what is macroeconomic
John Reply
macroeconomic is the branch of economics which studies actions, scale, activities and behaviour of the aggregate economy as a whole.
husaini
etc
husaini
difference between firm and industry
husaini Reply
what's the difference between a firm and an industry
Abdul
firm is the unit which transform inputs to output where as industry contain combination of firms with similar production 😅😅
Abdulraufu
Suppose the demand function that a firm faces shifted from Qd  120 3P to Qd  90  3P and the supply function has shifted from QS  20  2P to QS 10  2P . a) Find the effect of this change on price and quantity. b) Which of the changes in demand and supply is higher?
Toofiq Reply
explain standard reason why economic is a science
innocent Reply
factors influencing supply
Petrus Reply
what is economic.
Milan Reply
scares means__________________ends resources. unlimited
Jan
economics is a science that studies human behaviour as a relationship b/w ends and scares means which have alternative uses
Jan
calculate the profit maximizing for demand and supply
Zarshad Reply
Why qualify 28 supplies
Milan
what are explicit costs
Nomsa Reply
out-of-pocket costs for a firm, for example, payments for wages and salaries, rent, or materials
AI-Robot
concepts of supply in microeconomics
David Reply
economic overview notes
Amahle Reply
identify a demand and a supply curve
Salome Reply
i don't know
Parul
there's a difference
Aryan
Demand curve shows that how supply and others conditions affect on demand of a particular thing and what percent demand increase whith increase of supply of goods
Israr
Hi Sir please how do u calculate Cross elastic demand and income elastic demand?
Abari
Got questions? Join the online conversation and get instant answers!
Jobilize.com Reply
Practice Key Terms 5

Get Jobilize Job Search Mobile App in your pocket Now!

Get it on Google Play Download on the App Store Now


Source:  OpenStax, Algebra and trigonometry. OpenStax CNX. Nov 14, 2016 Download for free at https://legacy.cnx.org/content/col11758/1.6
Google Play and the Google Play logo are trademarks of Google Inc.

Notification Switch

Would you like to follow the 'Algebra and trigonometry' conversation and receive update notifications?

Ask