Throughout this section, we have learned about types of variations of sine and cosine functions and used that information to write equations from graphs. Now we can use the same information to create graphs from equations.
Instead of focusing on the general form equations
we will let
and
and work with a simplified form of the equations in the following examples.
Given the function
sketch its graph.
Identify the amplitude,
Identify the period,
Start at the origin, with the function increasing to the right if
is positive or decreasing if
is negative.
At
there is a local maximum for
or a minimum for
with
The curve returns to the
x -axis at
There is a local minimum for
(maximum for
) at
with
The curve returns again to the
x -axis at
Graphing a function and identifying the amplitude and period
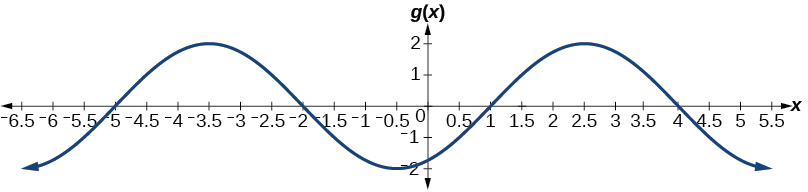
Sketch a graph of
Let’s begin by comparing the equation to the form
Step 1. We can see from the equation that
so the amplitude is 2.
Step 2. The equation shows that
so the period is
Step 3. Because
is negative, the graph descends as we move to the right of the origin.
Step 4–7. The
x -intercepts are at the beginning of one period,
the horizontal midpoints are at
and at the end of one period at
The quarter points include the minimum at
and the maximum at
A local minimum will occur 2 units below the midline, at
and a local maximum will occur at 2 units above the midline, at
[link] shows the graph of the function.
Given a sinusoidal function with a phase shift and a vertical shift, sketch its graph.
Express the function in the general form
Identify the amplitude,
Identify the period,
Identify the phase shift,
Draw the graph of
shifted to the right or left by
and up or down by
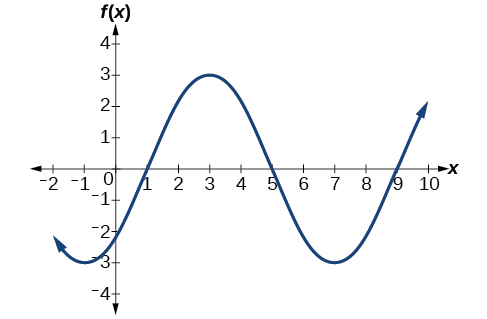
Graphing a transformed sinusoid
Sketch a graph of
Step 1. The function is already written in general form:
This graph will have the shape of a
sine function , starting at the midline and increasing to the right.
Step 2.
The amplitude is 3.
Step 3. Since
we determine the period as follows.
The period is 8.
Step 4. Since
the phase shift is
The phase shift is 1 unit.
Step 5.[link] shows the graph of the function.
A horizontally compressed, vertically stretched, and horizontally shifted sinusoid
the study of living organisms and their interactions with one another and their environment.
Wine
discuss the biological phenomenon and provide pieces of evidence to show that it was responsible for the formation of eukaryotic organelles in an essay form
advantage of electronic microscope is easily and clearly while disadvantage is dangerous because its electronic. advantage of light microscope is savely and naturally by sun while disadvantage is not easily,means its not sharp and not clear
Abdullahi
cell theory state that every organisms composed of one or more cell,cell is the basic unit of life
Abdullahi
is like gone fail us
DENG
cells is the basic structure and functions of all living things
A scanning electron microscope (SEM) is ideal for situations requiring high-resolution imaging of surfaces. It is commonly used in materials science, biology, and geology to examine the topography and composition of samples at a nanoscale level. SEM is particularly useful for studying fine details,


![A graph of 4sin((pi/5)x-pi/5)+4. Graph has period of 10, amplitude of 4, range of [0,8].](/ocw/mirror/col11758/m49387/CNX_Precalc_Figure_06_01_018n.jpg)
![A graph of -2sin((pi/2)x). Graph has range of [-2,2], period of 4, and amplitude of 2.](/ocw/mirror/col11758/m49387/CNX_Precalc_Figure_06_01_019.jpg)
![A graph of -0.8cos(2x). Graph has range of [-0.8, 0.8], period of pi, amplitude of 0.8, and is reflected about the x-axis compared to it's parent function cos(x).](/ocw/mirror/col11758/m49387/CNX_Precalc_Figure_06_01_020.jpg)