

| << Chapter < Page | Chapter >> Page > |
Given a logarithmic function with the form graph the translation.
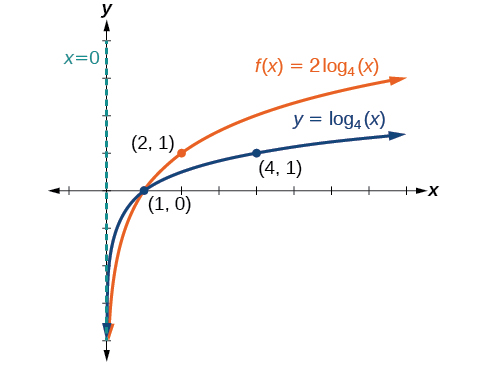
Sketch a graph of alongside its parent function. Include the key points and asymptote on the graph. State the domain, range, and asymptote.
Since the function is we will notice
This means we will stretch the function by a factor of 2.
The vertical asymptote is
Consider the three key points from the parent function, and
The new coordinates are found by multiplying the coordinates by 2.
Label the points and
The domain is the range is and the vertical asymptote is See [link] .
The domain is the range is and the vertical asymptote is
Sketch a graph of alongside its parent function. Include the key points and asymptote on the graph. State the domain, range, and asymptote.
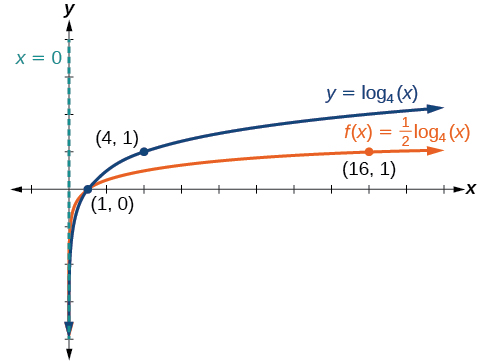
The domain is the range is and the vertical asymptote is
Sketch a graph of State the domain, range, and asymptote.
Remember: what happens inside parentheses happens first. First, we move the graph left 2 units, then stretch the function vertically by a factor of 5, as in [link] . The vertical asymptote will be shifted to The x -intercept will be The domain will be Two points will help give the shape of the graph: and We chose as the x -coordinate of one point to graph because when the base of the common logarithm.
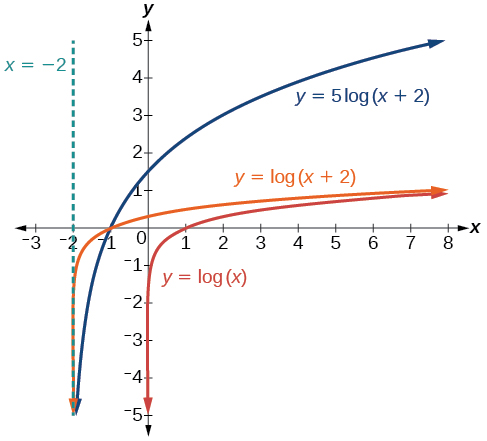
The domain is the range is and the vertical asymptote is
Sketch a graph of the function State the domain, range, and asymptote.
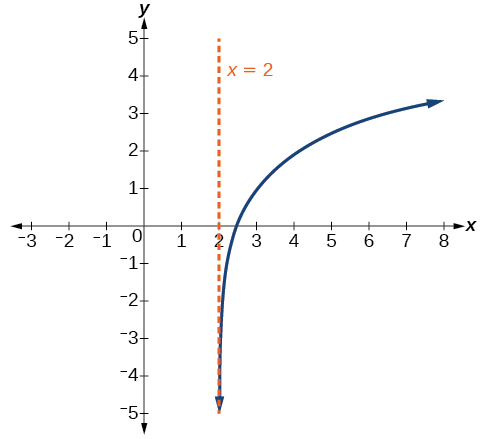
The domain is the range is and the vertical asymptote is
When the parent function is multiplied by the result is a reflection about the x -axis. When the input is multiplied by the result is a reflection about the y -axis. To visualize reflections, we restrict and observe the general graph of the parent function alongside the reflection about the x -axis, and the reflection about the y -axis,
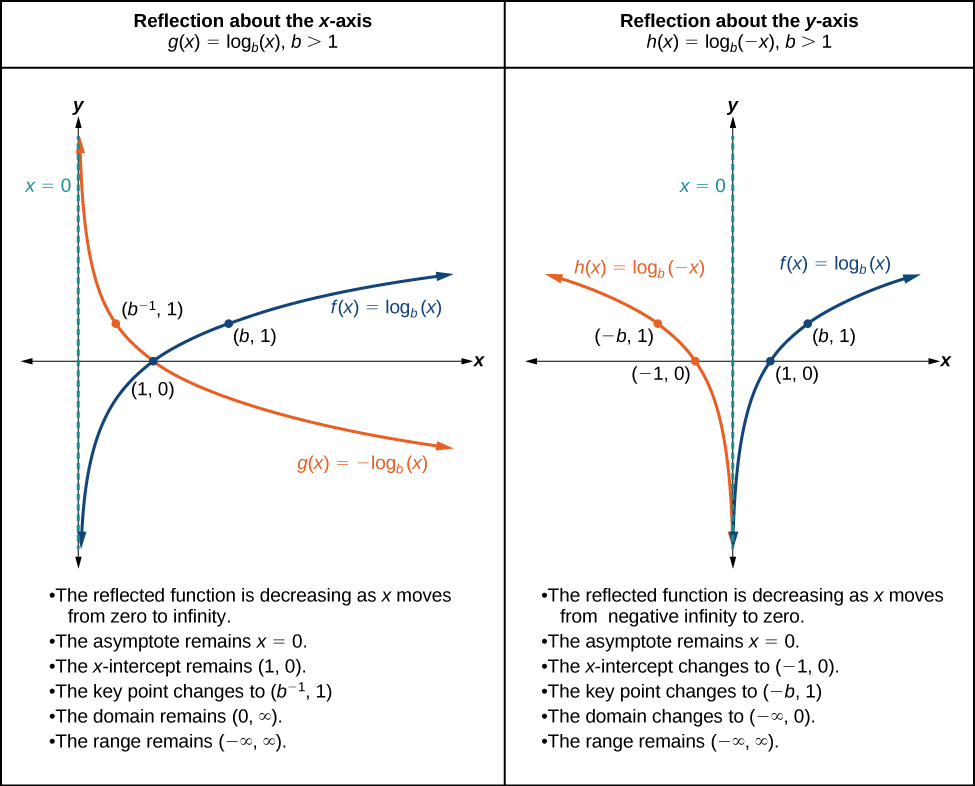
The function
The function
Notification Switch
Would you like to follow the 'Algebra and trigonometry' conversation and receive update notifications?

|
|
|
|
|

|
|

|
|

|
|

|
|

|
|

|
|
|
|
|
|
|

|
|

|