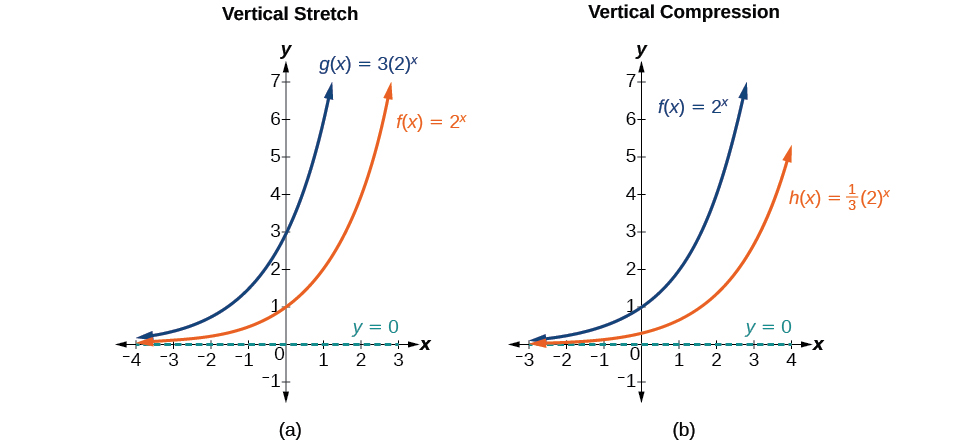
<< Chapter < Page Chapter >> Page >
Two graphs where graph a is an example of vertical stretch and graph b is an example of vertical compression.
(a) g ( x ) = 3 ( 2 ) x stretches the graph of f ( x ) = 2 x vertically by a factor of 3. (b) h ( x ) = 1 3 ( 2 ) x compresses the graph of f ( x ) = 2 x vertically by a factor of 1 3 .

Stretches and compressions of the parent function f ( x ) = b x

For any factor a > 0 , the function f ( x ) = a ( b ) x

  • is stretched vertically by a factor of a if | a | > 1.
  • is compressed vertically by a factor of a if | a | < 1.
  • has a y -intercept of ( 0 , a ) .
  • has a horizontal asymptote at y = 0 , a range of ( 0 , ) , and a domain of ( , ) , which are unchanged from the parent function.

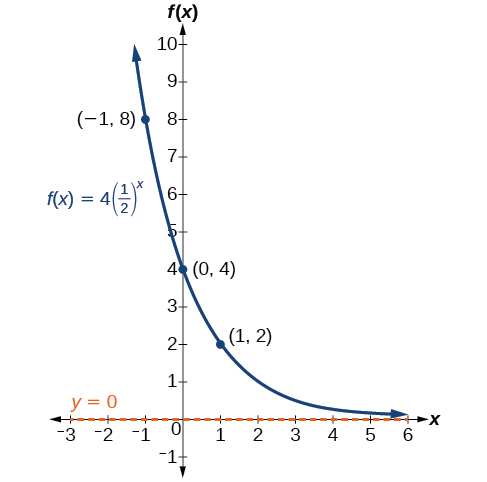
Graphing the stretch of an exponential function

Sketch a graph of f ( x ) = 4 ( 1 2 ) x . State the domain, range, and asymptote.

Before graphing, identify the behavior and key points on the graph.

  • Since b = 1 2 is between zero and one, the left tail of the graph will increase without bound as x decreases, and the right tail will approach the x -axis as x increases.
  • Since a = 4 , the graph of f ( x ) = ( 1 2 ) x will be stretched by a factor of 4.
  • Create a table of points as shown in [link] .
    x 3 2 1 0 1 2 3
    f ( x ) = 4 ( 1 2 ) x 32 16 8 4 2 1 0.5
  • Plot the y- intercept, ( 0 , 4 ) , along with two other points. We can use ( 1 , 8 ) and ( 1 , 2 ) .

Draw a smooth curve connecting the points, as shown in [link] .

Graph of the function, f(x) = 4(1/2)^(x), with an asymptote at y=0. Labeled points in the graph are (-1, 8), (0, 4), and (1, 2).

The domain is ( , ) ; the range is ( 0 , ) ; the horizontal asymptote is y = 0.

Got questions? Get instant answers now!

Sketch the graph of f ( x ) = 1 2 ( 4 ) x . State the domain, range, and asymptote.

The domain is ( , ) ; the range is ( 0 , ) ; the horizontal asymptote is y = 0.
Graph of the function, f(x) = (1/2)(4)^(x), with an asymptote at y=0. Labeled points in the graph are (-1, 0.125), (0, 0.5), and (1, 2).

Got questions? Get instant answers now!

Graphing reflections

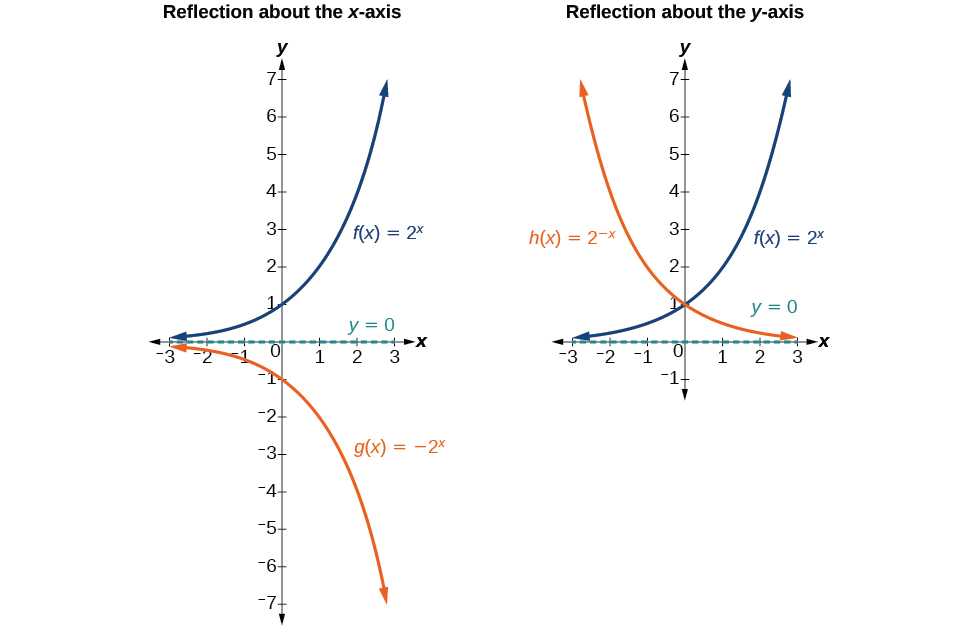
In addition to shifting, compressing, and stretching a graph, we can also reflect it about the x -axis or the y -axis. When we multiply the parent function f ( x ) = b x by −1 , we get a reflection about the x -axis. When we multiply the input by −1 , we get a reflection about the y -axis. For example, if we begin by graphing the parent function f ( x ) = 2 x , we can then graph the two reflections alongside it. The reflection about the x -axis, g ( x ) = −2 x , is shown on the left side of [link] , and the reflection about the y -axis h ( x ) = 2 x , is shown on the right side of [link] .

Two graphs where graph a is an example of a reflection about the x-axis and graph b is an example of a reflection about the y-axis.
(a) g ( x ) = 2 x reflects the graph of f ( x ) = 2 x about the x-axis. (b) g ( x ) = 2 x reflects the graph of f ( x ) = 2 x about the y -axis.

Reflections of the parent function f ( x ) = b x

The function f ( x ) = b x

  • reflects the parent function f ( x ) = b x about the x -axis.
  • has a y -intercept of ( 0 , 1 ) .
  • has a range of ( , 0 )
  • has a horizontal asymptote at y = 0 and domain of ( , ) , which are unchanged from the parent function.

The function f ( x ) = b x

  • reflects the parent function f ( x ) = b x about the y -axis.
  • has a y -intercept of ( 0 , 1 ) , a horizontal asymptote at y = 0 , a range of ( 0 , ) , and a domain of ( , ) , which are unchanged from the parent function.

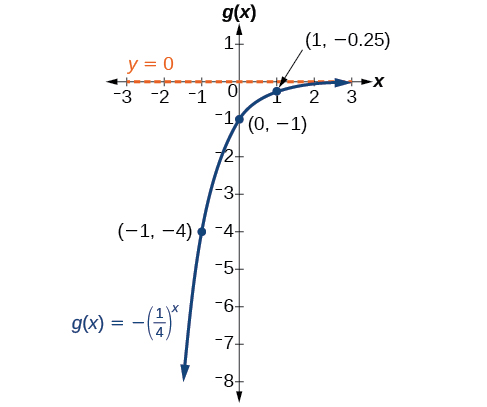
Writing and graphing the reflection of an exponential function

Find and graph the equation for a function, g ( x ) , that reflects f ( x ) = ( 1 4 ) x about the x -axis. State its domain, range, and asymptote.

Since we want to reflect the parent function f ( x ) = ( 1 4 ) x about the x- axis, we multiply f ( x ) by 1 to get, g ( x ) = ( 1 4 ) x . Next we create a table of points as in [link] .

x 3 2 1 0 1 2 3
g ( x ) = ( 1 4 ) x 64 16 4 1 0.25 0.0625 0.0156

Plot the y- intercept, ( 0 , −1 ) , along with two other points. We can use ( −1 , −4 ) and ( 1 , −0.25 ) .

Draw a smooth curve connecting the points:

Graph of the function, g(x) = -(0.25)^(x), with an asymptote at y=0. Labeled points in the graph are (-1, -4), (0, -1), and (1, -0.25).

The domain is ( , ) ; the range is ( , 0 ) ; the horizontal asymptote is y = 0.

Got questions? Get instant answers now!

Questions & Answers

Ayele, K., 2003. Introductory Economics, 3rd ed., Addis Ababa.
Widad Reply
can you send the book attached ?
Ariel
?
Ariel
What is economics
Widad Reply
the study of how humans make choices under conditions of scarcity
AI-Robot
U(x,y) = (x×y)1/2 find mu of x for y
Desalegn Reply
U(x,y) = (x×y)1/2 find mu of x for y
Desalegn
what is ecnomics
Jan Reply
this is the study of how the society manages it's scarce resources
Belonwu
what is macroeconomic
John Reply
macroeconomic is the branch of economics which studies actions, scale, activities and behaviour of the aggregate economy as a whole.
husaini
etc
husaini
difference between firm and industry
husaini Reply
what's the difference between a firm and an industry
Abdul
firm is the unit which transform inputs to output where as industry contain combination of firms with similar production 😅😅
Abdulraufu
Suppose the demand function that a firm faces shifted from Qd  120 3P to Qd  90  3P and the supply function has shifted from QS  20  2P to QS 10  2P . a) Find the effect of this change on price and quantity. b) Which of the changes in demand and supply is higher?
Toofiq Reply
explain standard reason why economic is a science
innocent Reply
factors influencing supply
Petrus Reply
what is economic.
Milan Reply
scares means__________________ends resources. unlimited
Jan
economics is a science that studies human behaviour as a relationship b/w ends and scares means which have alternative uses
Jan
calculate the profit maximizing for demand and supply
Zarshad Reply
Why qualify 28 supplies
Milan
what are explicit costs
Nomsa Reply
out-of-pocket costs for a firm, for example, payments for wages and salaries, rent, or materials
AI-Robot
concepts of supply in microeconomics
David Reply
economic overview notes
Amahle Reply
identify a demand and a supply curve
Salome Reply
i don't know
Parul
there's a difference
Aryan
Demand curve shows that how supply and others conditions affect on demand of a particular thing and what percent demand increase whith increase of supply of goods
Israr
Hi Sir please how do u calculate Cross elastic demand and income elastic demand?
Abari
Got questions? Join the online conversation and get instant answers!
Jobilize.com Reply

Get Jobilize Job Search Mobile App in your pocket Now!

Get it on Google Play Download on the App Store Now


Source:  OpenStax, Algebra and trigonometry. OpenStax CNX. Nov 14, 2016 Download for free at https://legacy.cnx.org/content/col11758/1.6
Google Play and the Google Play logo are trademarks of Google Inc.

Notification Switch

Would you like to follow the 'Algebra and trigonometry' conversation and receive update notifications?

Ask