<< Chapter < Page Chapter >> Page >

Cartesian coordinate system

A two-dimensional plane where the

  • x -axis is the horizontal axis
  • y -axis is the vertical axis

A point in the plane is defined as an ordered pair, ( x , y ) , such that x is determined by its horizontal distance from the origin and y is determined by its vertical distance from the origin.
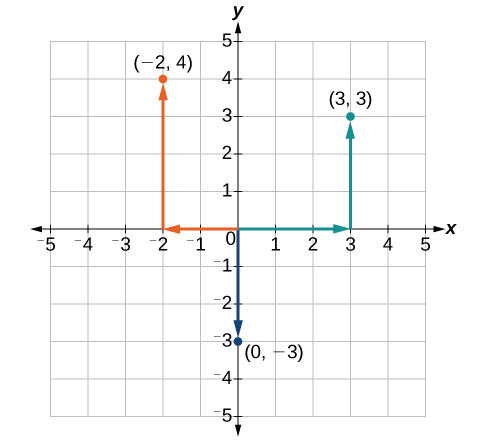
Plotting points in a rectangular coordinate system

Plot the points ( −2 , 4 ) , ( 3 , 3 ) , and ( 0 , −3 ) in the plane.

To plot the point ( −2 , 4 ) , begin at the origin. The x -coordinate is –2, so move two units to the left. The y -coordinate is 4, so then move four units up in the positive y direction.

To plot the point ( 3 , 3 ) , begin again at the origin. The x -coordinate is 3, so move three units to the right. The y -coordinate is also 3, so move three units up in the positive y direction.

To plot the point ( 0 , −3 ) , begin again at the origin. The x -coordinate is 0. This tells us not to move in either direction along the x -axis. The y -coordinate is –3, so move three units down in the negative y direction. See the graph in [link] .

This is an image of a graph on an x, y coordinate plane. The x and y axes range from negative 5 to 5.  The points (-2, 4); (3, 3); and (0, -3) are labeled.  Arrows extend from the origin to the points.
Got questions? Get instant answers now!

Graphing equations by plotting points

We can plot a set of points to represent an equation. When such an equation contains both an x variable and a y variable, it is called an equation in two variables    . Its graph is called a graph in two variables    . Any graph on a two-dimensional plane is a graph in two variables.
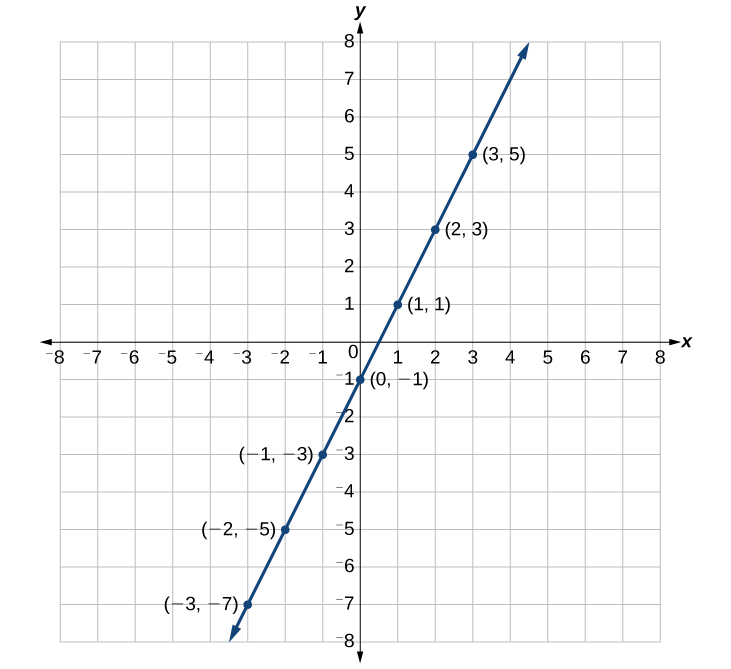
Suppose we want to graph the equation y = 2 x 1. We can begin by substituting a value for x into the equation and determining the resulting value of y . Each pair of x - and y -values is an ordered pair that can be plotted. [link] lists values of x from –3 to 3 and the resulting values for y .

x y = 2 x 1 ( x , y )
−3 y = 2 ( −3 ) 1 = −7 ( −3 , −7 )
−2 y = 2 ( −2 ) 1 = −5 ( −2 , −5 )
−1 y = 2 ( −1 ) 1 = −3 ( −1 , −3 )
0 y = 2 ( 0 ) 1 = −1 ( 0 , −1 )
1 y = 2 ( 1 ) 1 = 1 ( 1 , 1 )
2 y = 2 ( 2 ) 1 = 3 ( 2 , 3 )
3 y = 2 ( 3 ) 1 = 5 ( 3 , 5 )

We can plot the points in the table. The points for this particular equation form a line, so we can connect them. See [link] . This is not true for all equations.

This is a graph of a line on an x, y coordinate plane. The x- and y-axis range from negative 8 to 8.  A line passes through the points (-3, -7); (-2, -5); (-1, -3); (0, -1); (1, 1); (2, 3); and (3, 5).

Note that the x- values chosen are arbitrary, regardless of the type of equation we are graphing. Of course, some situations may require particular values of x to be plotted in order to see a particular result. Otherwise, it is logical to choose values that can be calculated easily, and it is always a good idea to choose values that are both negative and positive. There is no rule dictating how many points to plot, although we need at least two to graph a line. Keep in mind, however, that the more points we plot, the more accurately we can sketch the graph.

Given an equation, graph by plotting points.
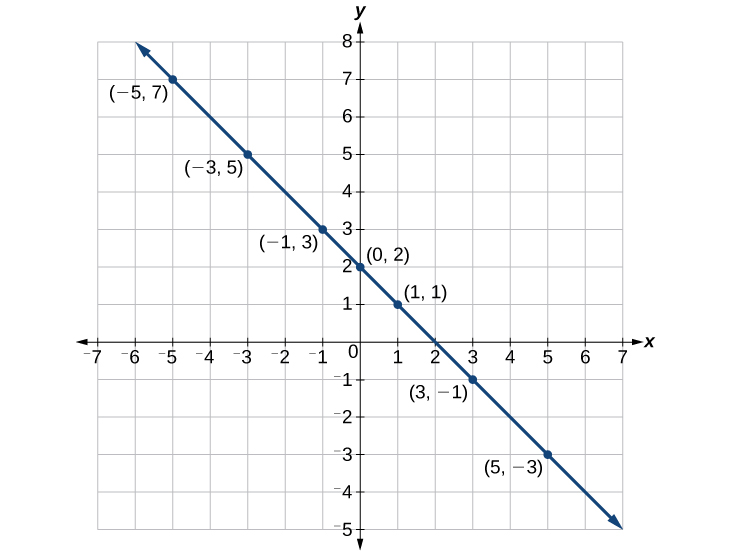
  1. Make a table with one column labeled x , a second column labeled with the equation, and a third column listing the resulting ordered pairs.
  2. Enter x- values down the first column using positive and negative values. Selecting the x- values in numerical order will make the graphing simpler.
  3. Select x- values that will yield y- values with little effort, preferably ones that can be calculated mentally.
  4. Plot the ordered pairs.
  5. Connect the points if they form a line.

Graphing an equation in two variables by plotting points

Graph the equation y = x + 2 by plotting points.

First, we construct a table similar to [link] . Choose x values and calculate y.

x y = x + 2 ( x , y )
−5 y = ( −5 ) + 2 = 7 ( −5 , 7 )
−3 y = ( −3 ) + 2 = 5 ( −3 , 5 )
−1 y = ( −1 ) + 2 = 3 ( −1 , 3 )
0 y = ( 0 ) + 2 = 2 ( 0 , 2 )
1 y = ( 1 ) + 2 = 1 ( 1 , 1 )
3 y = ( 3 ) + 2 = −1 ( 3 , −1 )
5 y = ( 5 ) + 2 = −3 ( 5 , −3 )

Now, plot the points. Connect them if they form a line. See [link]

This image is a graph of a line on an x, y coordinate plane. The x-axis includes numbers that range from negative 7 to 7. The y-axis includes numbers that range from negative 5 to 8.  A line passes through the  points: (-5, 7); (-3, 5); (-1, 3); (0, 2); (1, 1); (3, -1); and (5, -3).
Got questions? Get instant answers now!

Questions & Answers

Ayele, K., 2003. Introductory Economics, 3rd ed., Addis Ababa.
Widad Reply
can you send the book attached ?
Ariel
?
Ariel
What is economics
Widad Reply
the study of how humans make choices under conditions of scarcity
AI-Robot
U(x,y) = (x×y)1/2 find mu of x for y
Desalegn Reply
U(x,y) = (x×y)1/2 find mu of x for y
Desalegn
what is ecnomics
Jan Reply
this is the study of how the society manages it's scarce resources
Belonwu
what is macroeconomic
John Reply
macroeconomic is the branch of economics which studies actions, scale, activities and behaviour of the aggregate economy as a whole.
husaini
etc
husaini
difference between firm and industry
husaini Reply
what's the difference between a firm and an industry
Abdul
firm is the unit which transform inputs to output where as industry contain combination of firms with similar production 😅😅
Abdulraufu
Suppose the demand function that a firm faces shifted from Qd  120 3P to Qd  90  3P and the supply function has shifted from QS  20  2P to QS 10  2P . a) Find the effect of this change on price and quantity. b) Which of the changes in demand and supply is higher?
Toofiq Reply
explain standard reason why economic is a science
innocent Reply
factors influencing supply
Petrus Reply
what is economic.
Milan Reply
scares means__________________ends resources. unlimited
Jan
economics is a science that studies human behaviour as a relationship b/w ends and scares means which have alternative uses
Jan
calculate the profit maximizing for demand and supply
Zarshad Reply
Why qualify 28 supplies
Milan
what are explicit costs
Nomsa Reply
out-of-pocket costs for a firm, for example, payments for wages and salaries, rent, or materials
AI-Robot
concepts of supply in microeconomics
David Reply
economic overview notes
Amahle Reply
identify a demand and a supply curve
Salome Reply
i don't know
Parul
there's a difference
Aryan
Demand curve shows that how supply and others conditions affect on demand of a particular thing and what percent demand increase whith increase of supply of goods
Israr
Hi Sir please how do u calculate Cross elastic demand and income elastic demand?
Abari
Got questions? Join the online conversation and get instant answers!
Jobilize.com Reply

Get Jobilize Job Search Mobile App in your pocket Now!

Get it on Google Play Download on the App Store Now


Source:  OpenStax, Algebra and trigonometry. OpenStax CNX. Nov 14, 2016 Download for free at https://legacy.cnx.org/content/col11758/1.6
Google Play and the Google Play logo are trademarks of Google Inc.

Notification Switch

Would you like to follow the 'Algebra and trigonometry' conversation and receive update notifications?

Ask