

| << Chapter < Page | Chapter >> Page > |
Given the function in [link] , identify the intervals on which the function appears to be increasing.
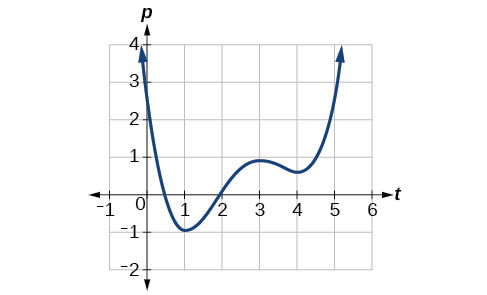
We see that the function is not constant on any interval. The function is increasing where it slants upward as we move to the right and decreasing where it slants downward as we move to the right. The function appears to be increasing from to and from on.
In interval notation , we would say the function appears to be increasing on the interval (1,3) and the interval
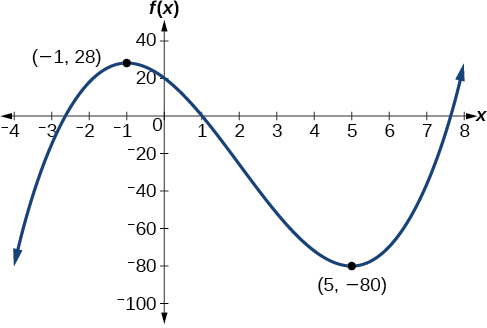
Graph the function Then use the graph to estimate the local extrema of the function and to determine the intervals on which the function is increasing.
Using technology, we find that the graph of the function looks like that in [link] . It appears there is a low point, or local minimum, between and and a mirror-image high point, or local maximum, somewhere between and
Graph the function to estimate the local extrema of the function. Use these to determine the intervals on which the function is increasing and decreasing.
The local maximum appears to occur at and the local minimum occurs at The function is increasing on and decreasing on
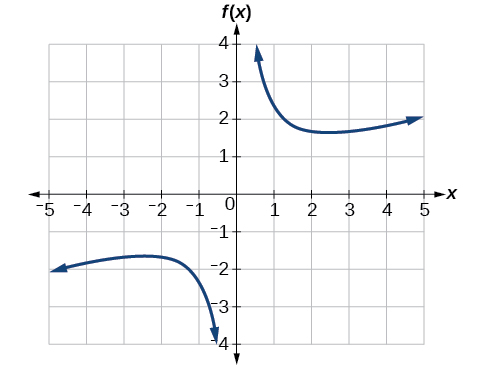
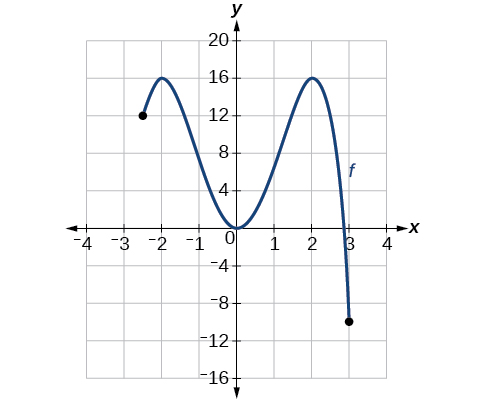
For the function whose graph is shown in [link] , find all local maxima and minima.
Observe the graph of The graph attains a local maximum at because it is the highest point in an open interval around The local maximum is the -coordinate at which is
The graph attains a local minimum at because it is the lowest point in an open interval around The local minimum is the y -coordinate at which is
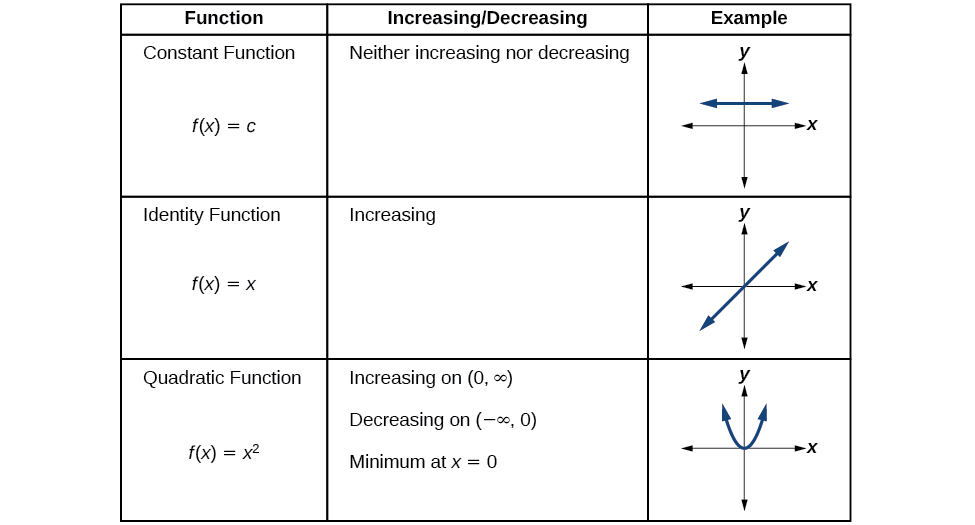
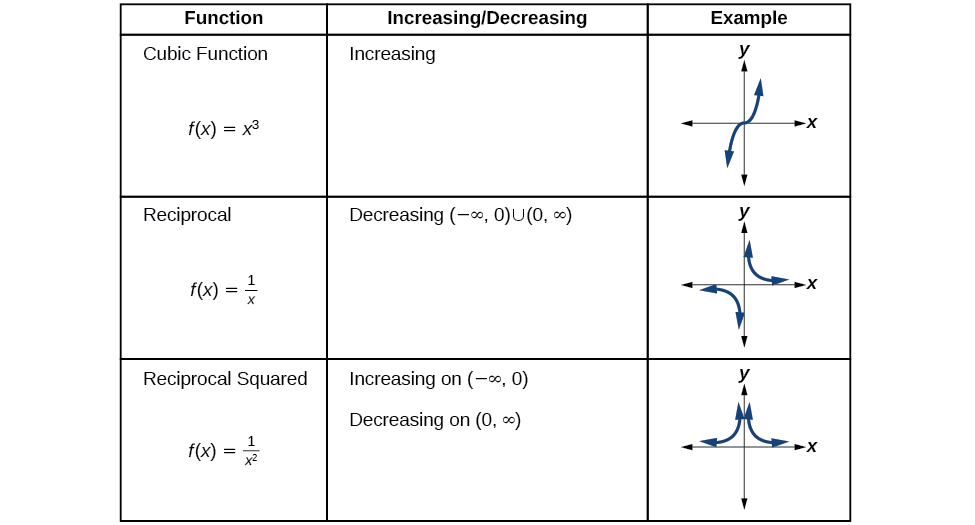
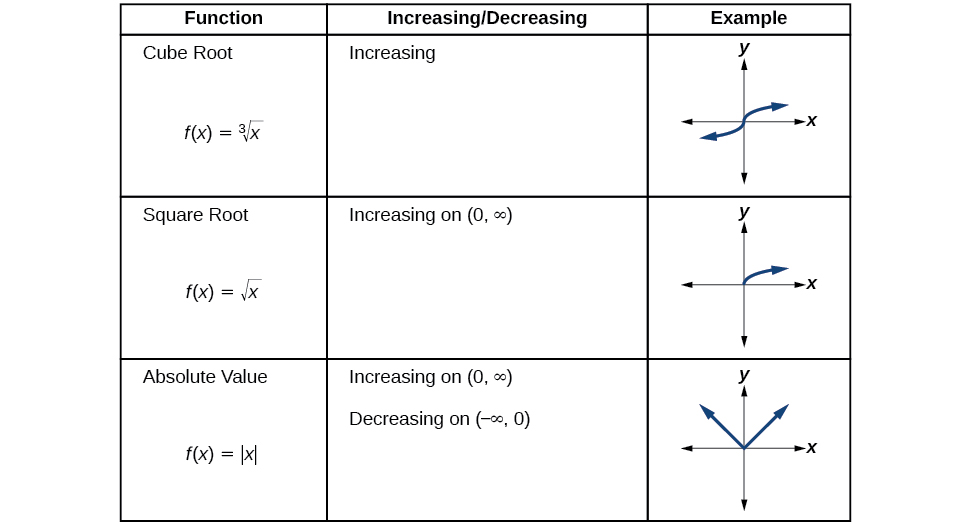
We will now return to our toolkit functions and discuss their graphical behavior in [link] , [link] , and [link] .
There is a difference between locating the highest and lowest points on a graph in a region around an open interval (locally) and locating the highest and lowest points on the graph for the entire domain. The coordinates (output) at the highest and lowest points are called the absolute maximum and absolute minimum , respectively.
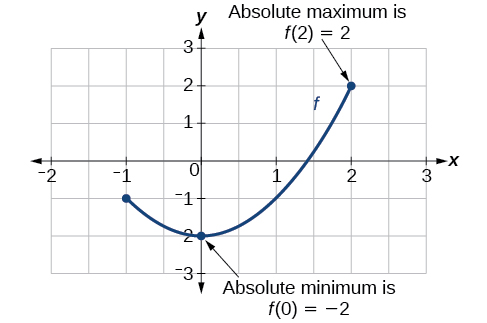
To locate absolute maxima and minima from a graph, we need to observe the graph to determine where the graph attains it highest and lowest points on the domain of the function. See [link] .
Not every function has an absolute maximum or minimum value. The toolkit function is one such function.
The absolute maximum of at is where for all in the domain of
The absolute minimum of at is where for all in the domain of
For the function shown in [link] , find all absolute maxima and minima.
Observe the graph of The graph attains an absolute maximum in two locations, and because at these locations, the graph attains its highest point on the domain of the function. The absolute maximum is the y -coordinate at and which is
The graph attains an absolute minimum at because it is the lowest point on the domain of the function’s graph. The absolute minimum is the y -coordinate at which is
Notification Switch
Would you like to follow the 'Algebra and trigonometry' conversation and receive update notifications?

|
|
|
|
|

|
|

|
|
|
|

|
|

|
|

|
|

|
|

|
|

|
|

|