

| << Chapter < Page | Chapter >> Page > |
If we let and in the general form equations of the sine and cosine functions, we obtain the forms
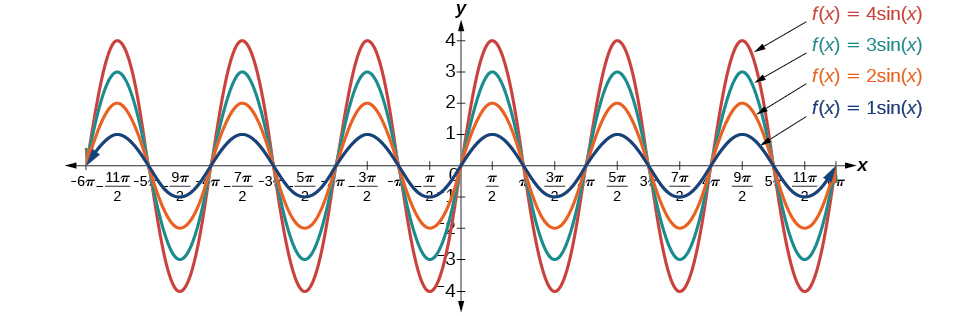
The amplitude is and the vertical height from the midline is In addition, notice in the example that
What is the amplitude of the sinusoidal function Is the function stretched or compressed vertically?
Let’s begin by comparing the function to the simplified form
In the given function, so the amplitude is The function is stretched.
What is the amplitude of the sinusoidal function Is the function stretched or compressed vertically?
compressed
Now that we understand how and relate to the general form equation for the sine and cosine functions, we will explore the variables and Recall the general form:
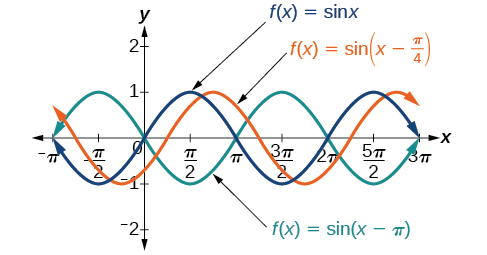
The value for a sinusoidal function is called the phase shift , or the horizontal displacement of the basic sine or cosine function . If the graph shifts to the right. If the graph shifts to the left. The greater the value of the more the graph is shifted. [link] shows that the graph of shifts to the right by units, which is more than we see in the graph of which shifts to the right by units.
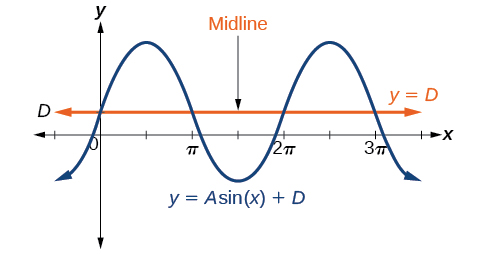
While relates to the horizontal shift, indicates the vertical shift from the midline in the general formula for a sinusoidal function. See [link] . The function has its midline at
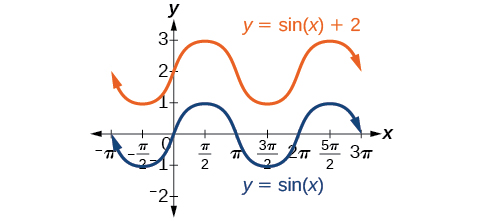
Any value of other than zero shifts the graph up or down. [link] compares with which is shifted 2 units up on a graph.
Given an equation in the form or is the phase shift and is the vertical shift .
Determine the direction and magnitude of the phase shift for
Let’s begin by comparing the equation to the general form
In the given equation, notice that and So the phase shift is
or units to the left.
Determine the direction and magnitude of the phase shift for
right
Determine the direction and magnitude of the vertical shift for
Let’s begin by comparing the equation to the general form
In the given equation, so the shift is 3 units downward.
Determine the direction and magnitude of the vertical shift for
2 units up
Given a sinusoidal function in the form identify the midline, amplitude, period, and phase shift.
Notification Switch
Would you like to follow the 'Algebra and trigonometry' conversation and receive update notifications?

|
|
|
|
|

|
|

|
|

|
|
|
|
|

|
|

|
|
|
|
|

|
|

|
|

|