<< Chapter < Page Chapter >> Page >
In this section, you will:
  • Construct probability models.
  • Compute probabilities of equally likely outcomes.
  • Compute probabilities of the union of two events.
  • Use the complement rule to find probabilities.
  • Compute probability using counting theory.
Spaghetti map of the possible paths for a hurricane over the Southeastern United States
An example of a “spaghetti model,” which can be used to predict possible paths of a tropical storm. The figure is for illustrative purposes only and does not model any particular storm.

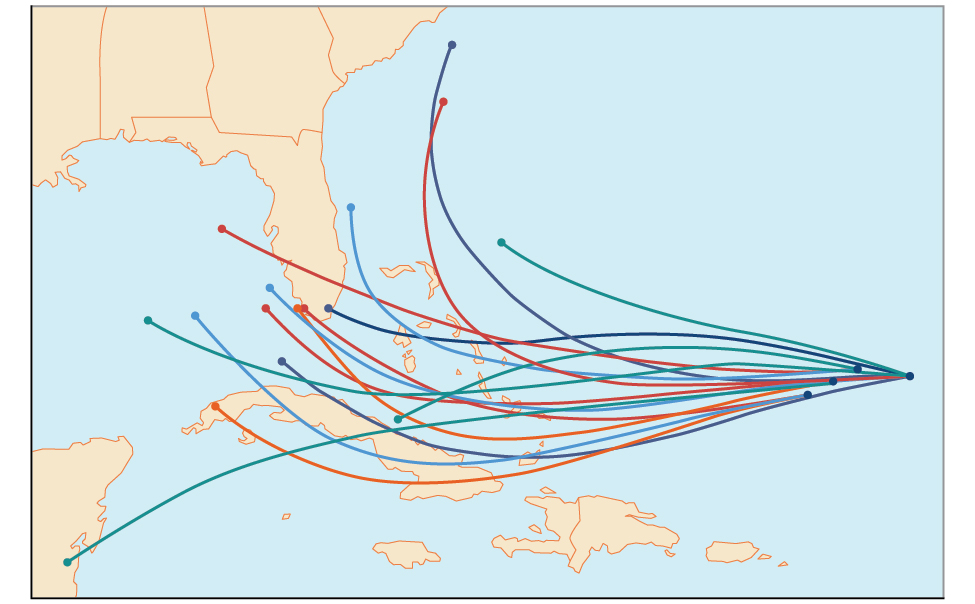
Residents of the Southeastern United States are all too familiar with charts, known as spaghetti models, such as the one in [link] . They combine a collection of weather data to predict the most likely path of a hurricane. Each colored line represents one possible path. The group of squiggly lines can begin to resemble strands of spaghetti, hence the name. In this section, we will investigate methods for making these types of predictions.

Constructing probability models

Suppose we roll a six-sided number cube. Rolling a number cube is an example of an experiment    , or an activity with an observable result. The numbers on the cube are possible results, or outcomes    , of this experiment. The set of all possible outcomes of an experiment is called the sample space    of the experiment. The sample space for this experiment is { 1 , 2 , 3 , 4 , 5 , 6 } . An event    is any subset of a sample space.

The likelihood of an event is known as probability    . The probability of an event p is a number that always satisfies 0 p 1 , where 0 indicates an impossible event and 1 indicates a certain event. A probability model    is a mathematical description of an experiment listing all possible outcomes and their associated probabilities. For instance, if there is a 1% chance of winning a raffle and a 99% chance of losing the raffle, a probability model would look much like [link] .

Outcome Probability
Winning the raffle 1%
Losing the raffle 99%

The sum of the probabilities listed in a probability model must equal 1, or 100%.

Given a probability event where each event is equally likely, construct a probability model.

  1. Identify every outcome.
  2. Determine the total number of possible outcomes.
  3. Compare each outcome to the total number of possible outcomes.

Constructing a probability model

Construct a probability model for rolling a single, fair die, with the event being the number shown on the die.

Begin by making a list of all possible outcomes for the experiment. The possible outcomes are the numbers that can be rolled: 1, 2, 3, 4, 5, and 6. There are six possible outcomes that make up the sample space.

Assign probabilities to each outcome in the sample space by determining a ratio of the outcome to the number of possible outcomes. There is one of each of the six numbers on the cube, and there is no reason to think that any particular face is more likely to show up than any other one, so the probability of rolling any number is 1 6 .

Outcome Roll of 1 Roll of 2 Roll of 3 Roll of 4 Roll of 5 Roll of 6
Probability 1 6 1 6 1 6 1 6 1 6 1 6
Got questions? Get instant answers now!

Do probabilities always have to be expressed as fractions?

No. Probabilities can be expressed as fractions, decimals, or percents. Probability must always be a number between 0 and 1, inclusive of 0 and 1.

Questions & Answers

how do you get the 2/50
Abba Reply
number of sport play by 50 student construct discrete data
Aminu Reply
width of the frangebany leaves on how to write a introduction
Theresa Reply
Solve the mean of variance
Veronica Reply
Step 1: Find the mean. To find the mean, add up all the scores, then divide them by the number of scores. ... Step 2: Find each score's deviation from the mean. ... Step 3: Square each deviation from the mean. ... Step 4: Find the sum of squares. ... Step 5: Divide the sum of squares by n – 1 or N.
kenneth
what is error
Yakuba Reply
Is mistake done to something
Vutshila
Hy
anas
hy
What is the life teble
anas
hy
Jibrin
statistics is the analyzing of data
Tajudeen Reply
what is statics?
Zelalem Reply
how do you calculate mean
Gloria Reply
diveving the sum if all values
Shaynaynay
let A1,A2 and A3 events be independent,show that (A1)^c, (A2)^c and (A3)^c are independent?
Fisaye Reply
what is statistics
Akhisani Reply
data collected all over the world
Shaynaynay
construct a less than and more than table
Imad Reply
The sample of 16 students is taken. The average age in the sample was 22 years with astandard deviation of 6 years. Construct a 95% confidence interval for the age of the population.
Aschalew Reply
Bhartdarshan' is an internet-based travel agency wherein customer can see videos of the cities they plant to visit. The number of hits daily is a normally distributed random variable with a mean of 10,000 and a standard deviation of 2,400 a. what is the probability of getting more than 12,000 hits? b. what is the probability of getting fewer than 9,000 hits?
Akshay Reply
Bhartdarshan'is an internet-based travel agency wherein customer can see videos of the cities they plan to visit. The number of hits daily is a normally distributed random variable with a mean of 10,000 and a standard deviation of 2,400. a. What is the probability of getting more than 12,000 hits
Akshay
1
Bright
Sorry i want to learn more about this question
Bright
Someone help
Bright
a= 0.20233 b=0.3384
Sufiyan
a
Shaynaynay
How do I interpret level of significance?
Mohd Reply
It depends on your business problem or in Machine Learning you could use ROC- AUC cruve to decide the threshold value
Shivam
how skewness and kurtosis are used in statistics
Owen Reply
yes what is it
Taneeya
Got questions? Join the online conversation and get instant answers!
Jobilize.com Reply
Practice Key Terms 9

Get Jobilize Job Search Mobile App in your pocket Now!

Get it on Google Play Download on the App Store Now


Source:  OpenStax, Algebra and trigonometry. OpenStax CNX. Nov 14, 2016 Download for free at https://legacy.cnx.org/content/col11758/1.6
Google Play and the Google Play logo are trademarks of Google Inc.

Notification Switch

Would you like to follow the 'Algebra and trigonometry' conversation and receive update notifications?

Ask